Data basis: Nasdaq 100, S&P 500 and Dow (cash session 09:30 to 16:00 New York) and DAX (09:00 to 17:30 Berlin), Dukascopy CFD minute data, aggregated into 1-, 5- and 15-minute candles. Search period 2015–2022. The holdout from 2023 stayed untouched because the gate was missed. Volume for the VWAP: tick activity of the CFD feed, which is what a CFD chart shows as volume. Costs per round trip by market, 2.54 bps on average for the main rule (1 bp = 0.01%). Benchmarks: the same rule with the day's open instead of the VWAP, random direction (2,000 times), always long from the same entry, random markets. Pre-registered on 19 October 2026 before the first calculation (SHA-256 c889edc1…). No trading recommendation.
The VWAP (volume-weighted average price since the session start) is seen as the fair price of the day, the EMA(9) as a fast trend line. When the fast line crosses the VWAP upwards, you buy, downwards you sell. The rule appears in many day-trading courses and was missing from our earlier indicator scan: that scan included EMA crossovers with each other (one of 640 cells with net t ≥ 2) and price crossing the VWAP (zero of 280), but not this combination.
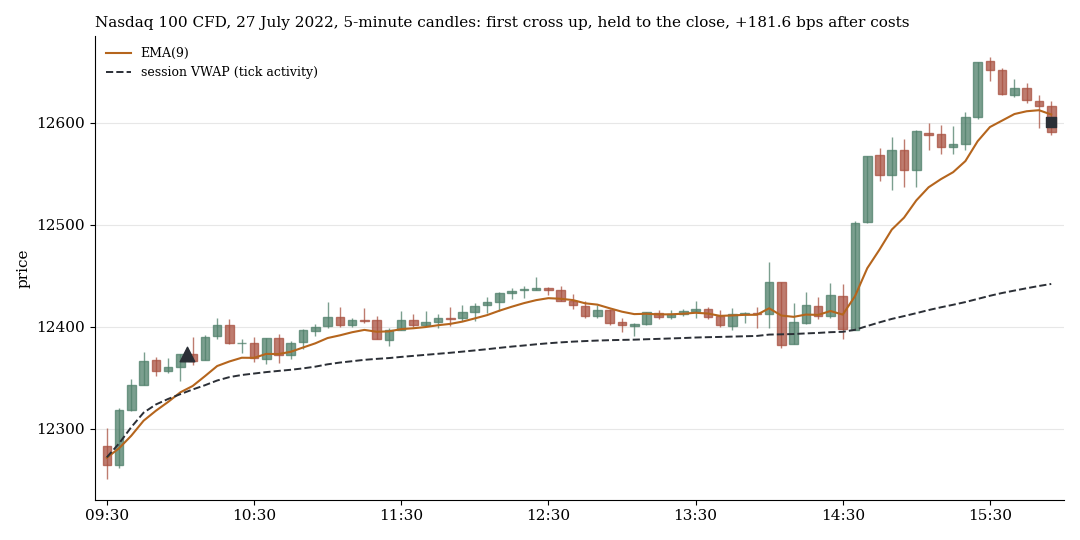
27 July 2022: the EMA(9) crosses the VWAP upwards at 10:05, long until 15:59, +181.6 bps after costs. A trend day, the kind the rule needs.
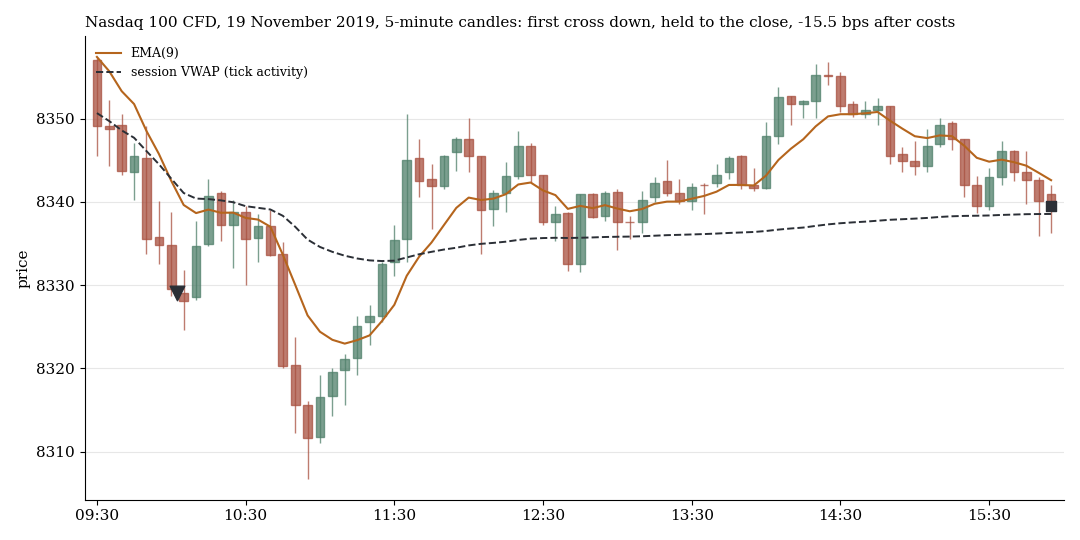
19 November 2019: cross downwards at 10:05, short, the price first falls further and then turns, −15.5 bps. Both days were drawn at random with a fixed seed (7) from the winning and losing days of the main rule in the Nasdaq 100.
1. Rules
| Element | Specification |
|---|---|
| EMA(9) | on candle closes, continuous across all candles including the night (as in TradingView and MT5) |
| VWAP | from the cash open, sum of typical price (high, low, close averaged) times volume divided by volume |
| Cross | change of sign of EMA minus VWAP at the candle close, at the earliest 15 minutes after the open |
| Entry | open of the minute after the candle close |
| R1 stop-and-reverse | every cross flips the position, exit at the last session minute |
| R2 first cross | only the first cross of the day, hold until the last session minute |
| Primary rule | R2 on 5-minute candles, averaged across the four markets per day |
| Gate to the holdout | net t ≥ 2, q ≤ 0.10 across 26 tests and better than the open variant |
2. Stop-and-reverse: costs eat everything
| Candles | Nasdaq 100 | S&P 500 | Dow | DAX | Trades per day |
|---|---|---|---|---|---|
| 1 minute | −12.24 | −11.92 | −5.20 | −11.78 | 5.1 to 6.4 |
| 5 minutes | −1.99 | −2.14 | −0.07 | −2.60 | 2.5 to 3.1 |
| 15 minutes | −0.83 | −1.92 | −0.36 | −1.47 | 1.4 to 1.7 |
Net bps per market day, search period 2015–2022, about 2,000 days per cell.
On 1-minute candles the rule flips five to six times a day, and every flip costs the spread. All twelve cells are negative, the 1-minute cells at t −3.3 to −7.0. On random markets the 5-minute variant even loses −8.6 and −8.2 bps per day, so the real data is better than chance, but not positive.
3. The first cross: direction yes, edge no
| Candles | Nasdaq 100 | S&P 500 | Dow | DAX |
|---|---|---|---|---|
| 1 minute | −3.12 (t −1.4) | −4.94 (t −2.8) | −0.32 (t −0.2) | −1.02 (t −0.5) |
| 5 minutes | +3.85 (t 1.8) | +1.47 (t 0.9) | +1.59 (t 1.0) | −0.15 (t −0.1) |
| 15 minutes | +2.97 (t 1.5) | +1.25 (t 0.8) | +1.75 (t 1.1) | +0.41 (t 0.2) |
Net bps per market day. Averaged across the four markets (5 minutes, 2,048 days): +1.35 bps, t 1.12, q 0.83.
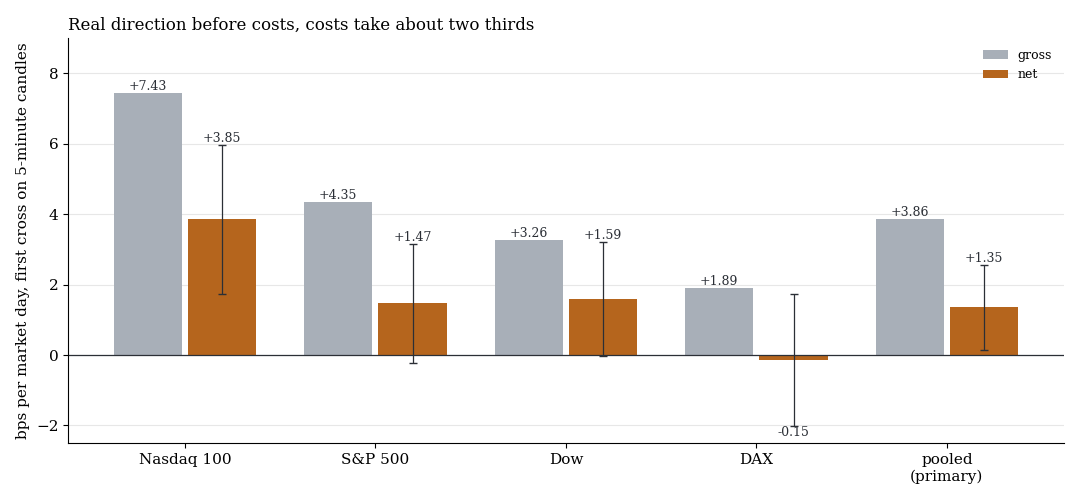
Gross (grey) and net (orange) per market day, net with one standard error. Before costs the direction is positive in all four markets, and costs take about two thirds of it.
The primary rule clearly misses the gate. Before costs, however, there is real directional information in it, and that belongs to an honest result. The following numbers are descriptive and were not pre-registered: gross the rule makes +3.86 bps per day (t 3.22), per trade +5.2 bps long and +3.1 bps short. With random direction the mean is −2.49 bps, and none of 2,000 draws was as good. The VWAP beats the variant using the day's open by +4.34 bps per day (t 2.34), so it really does contribute something. Always long from the same entry made only +1.16 bps gross. On two random markets the rule loses −2.24 and −2.70 bps.
4. Only in volatile years
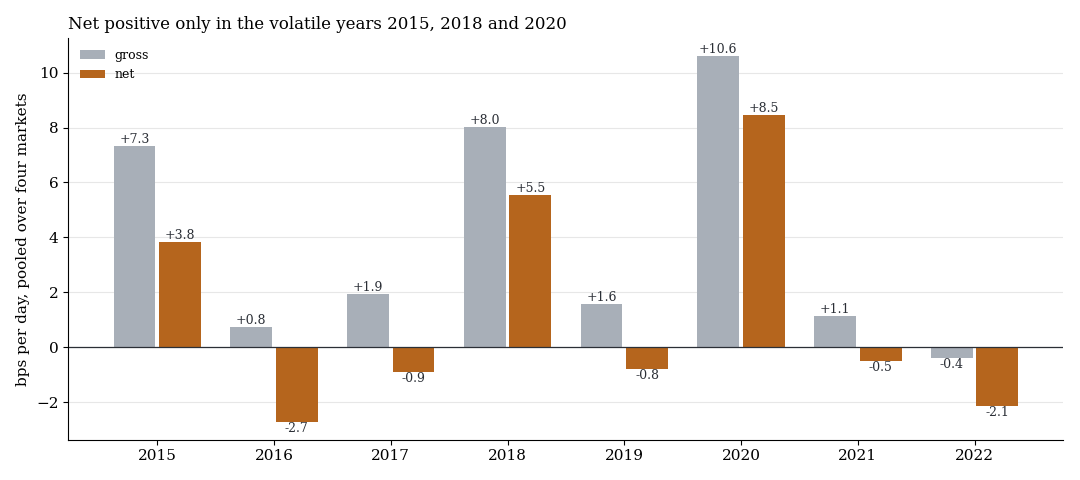
Gross and net per day, averaged across the four markets. Net positive only in 2015, 2018 and 2020.
Net results were +3.8 bps in 2015, +5.5 in 2018 and +8.5 in 2020. The other five years were between −2.7 and −0.5 bps. The rule lives on days on which a trend carries through after the first half hour, and such days are rare in calm years. That fits our finding that breakout rules need high volatility.
What it means
EMA9 over VWAP is not an empty pattern: before costs the first cross of the day is right more often than chance, and the VWAP does better than a fixed level. With CFD spreads of about 2.5 bps per round trip, though, too little is left on average to separate it from noise, and nothing in five of eight years. Flipping the cross on 1-minute candles at every opposite signal pays the spread five to six times a day. We see this pattern with many indicators: a few basis points of real information that costs eat up (VWAP and indicators intraday).
Limits
- Volume. The VWAP uses the tick activity of the CFD feed, not real futures volume. It is the VWAP a CFD trader sees on the chart, but it can differ from the exchange VWAP.
- Fixed parameters. EMA length 9, three timeframes, start 15 minutes after the open. We deliberately optimised nothing.
- No holdout. Because the gate was missed, the period from 2023 stayed untouched. The gross numbers and the yearly breakdown are description, not a confirmed rule.
- Verification. We checked the core on 25 random days against an independent second calculation: 24 identical, and the one difference is a cross at a distance of almost zero, where rounding decides.
- Not tested: filters for volatile days (would only make sense as a new pre-registration directly in the holdout), stops and targets, other markets.
All pattern families of the scan in the overview. Related: VWAP and indicators intraday, the first 5-minute candle and the +982% and breakouts need high volatility.
📄 Full study as PDF: 7 pages incl. all tables, figures and limits (in German).
Disclaimer: Historical statistics are no guarantee of future market behaviour. This study is not investment advice. Trading carries a risk of loss up to total loss.