Data basis: Nasdaq 100, S&P 500, Dow Jones and DAX as CFDs; Dukascopy minute data (BID) as 5-minute candles. Periods 2015–2018 and 2019–2026 (to 5 June 2026). Costs: round trip (buy plus sell) of spread plus slippage (Nasdaq 2.5 index points, S&P 500 0.8, Dow 4.0, DAX 2.5). Benchmark: “always long” in the same hours. Nothing was selected or optimised; 2019–2026 contains the holdout of our scan (from 2023), read once here, descriptively. No trading recommendation.
A publicly shown backtest claims: if the first 5-minute candle after the open closes above the EMA(12), you buy, below it you sell. The EMA(12) is an exponentially weighted average of the last 12 closing prices. The backtest's result: +982% from 2019 to 2026. The rule is simple, the period a bull market, and the number impresses.
We do not know the instrument, the exit or the position size, so we ran the obvious variants: EMA over all candles round the clock or over the cash-session candles only, exit at the cash close or at a stop on the opposite side of the first candle. Entry is at the open of the minute after the first candle.
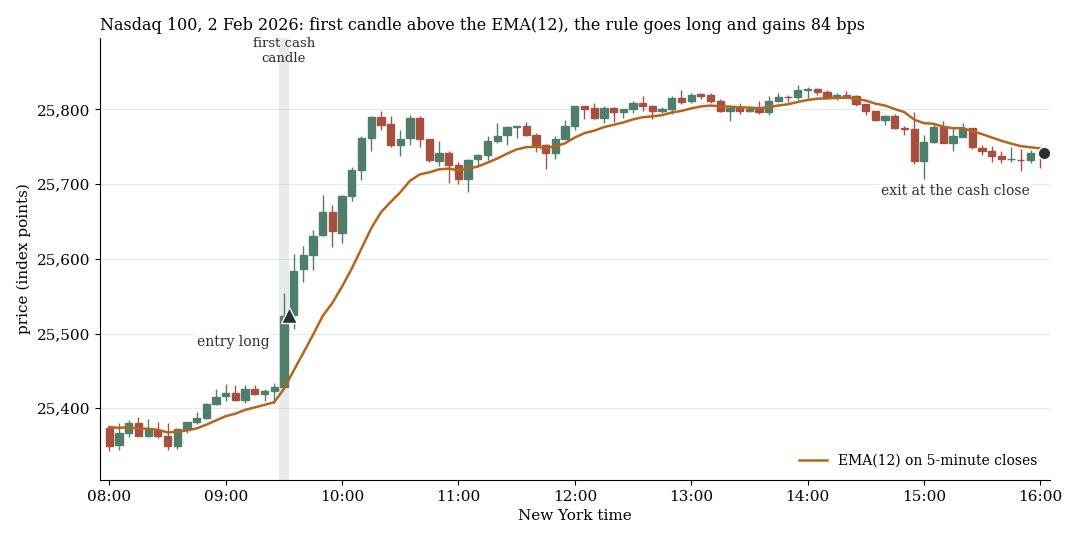
Nasdaq 100, 2 February 2026: the first cash candle (grey) closes above the EMA(12), the rule buys until the cash close and gains 84 bps (basis points, 1 bp = 0.01%) after costs. Both example days were drawn at random with a fixed seed, from days with a buy signal and a result of at least +50 or at most −50 bps.
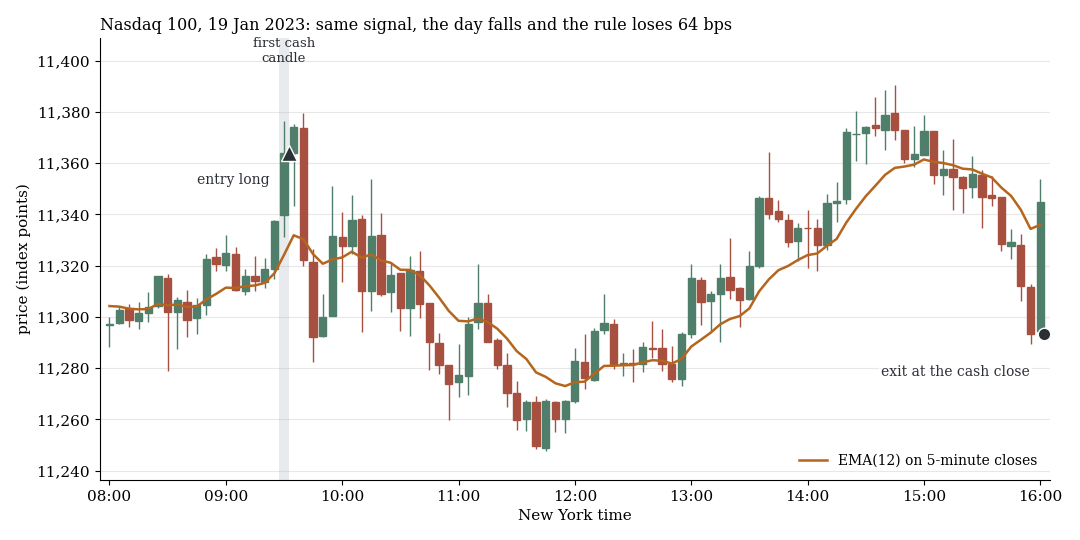
The same signal on 19 January 2023: the day falls and the rule loses 64 bps.
1. The order of magnitude comes from leverage and a bull market
On the Nasdaq (2019 to June 2026, EMA over all candles, exit at the cash close) the rule makes +129% after costs without leverage, “always long” +122%. The backtest's +982% lies between the four-times-leveraged values of the rule (+573% with, +2,650% without costs). The order of magnitude needs no informational edge.
| Nasdaq, 2019 to June 2026 | no leverage | four times |
|---|---|---|
| Rule, no costs | +226% | +2,650% |
| Rule, after costs | +129% | +573% |
| always long, no costs | +122% | +480% |
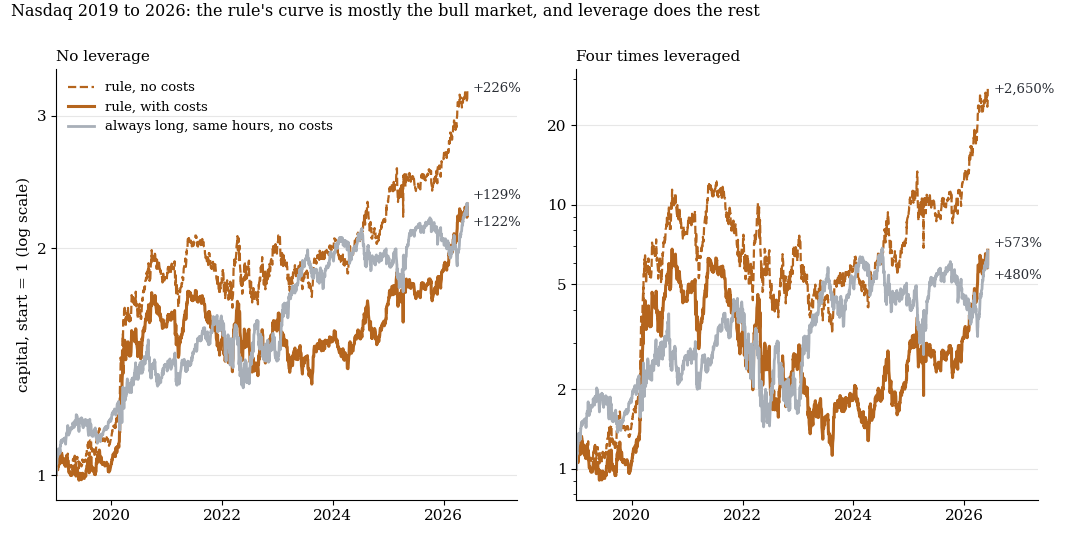
Nasdaq, compounded daily, start = 1, logarithmic axis; no leverage on the left, four times on the right. “Always long” is computed without costs.
2. The lead over “always long” cannot be told apart from zero
The fair comparison is per day, because rule and benchmark each pay one round trip. In the equity curve the gap looks large (+226% against +122% before costs), but per day it is only +2.07 bps (t 0.57, n 1,849) on the Nasdaq and +0.99 bps (t 0.35) on the S&P 500. The error range is larger than the lead. Only 2015–2018 shows the Nasdaq at +9.90 bps (t 2.36, S&P 500 +4.45 bps, t 1.43): one value with |t| ≥ 2 out of four, before the claimed period.
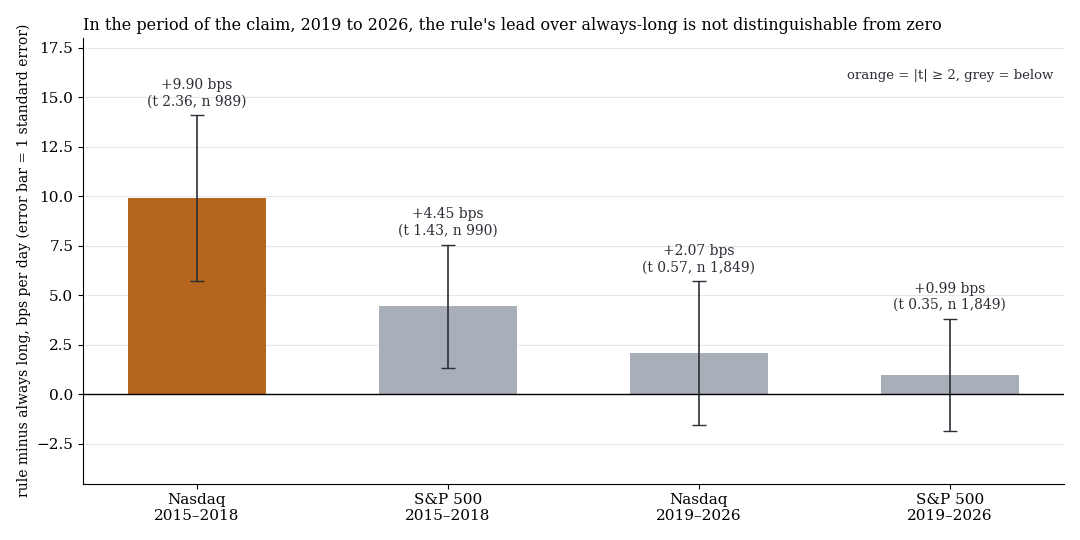
Rule minus “always long” in bps per day, gross, with one standard error. Orange: |t| ≥ 2.
3. Not every market, not every EMA calculation
| 2019–2026, bps per day | Rule gross | Rule net (t) | net (t), EMA from cash candles only | always long, gross |
|---|---|---|---|---|
| Nasdaq | +7.03 | +5.12 (1.94) | −0.56 (−0.21) | +4.95 |
| S&P 500 | +4.51 | +2.59 (1.26) | −2.46 (−1.19) | +3.52 |
| Dow | −0.40 | −1.59 (−0.82) | −5.41 (−2.80) | +2.66 |
| DAX | +0.80 | −0.83 (−0.41) | +0.99 (0.49) | +2.39 |
Columns 2 and 3 compute the EMA over all candles, exit at the cash close. On the Dow the rule is negative in all four variants (net −5.41 to −1.58 bps). A small change flips the Nasdaq: compute the EMA from the cash-session candles only and it falls from +5.12 to −0.56 bps per day.
4. Five questions for any outside backtest
- Risk per trade and leverage? The same signal gives +129% unleveraged and +573% at four times leverage.
- Stop and simulation? With a stop on the opposite side of the first candle (computed without slippage) the Nasdaq falls from +5.12 to +2.11 bps per day.
- Costs? At four times leverage they separate +2,650% from +573%.
- Comparison with simply holding? “Always long” returns +122%, and the rule's lead is +2.07 bps per day (t 0.57).
- Period and markets? 2015–2018 looked different, on the Dow the rule is negative, and a different EMA calculation flips the Nasdaq.
What it means
The +982% figure is no evidence of an informational edge in the first candle. Leverage and a bull market are enough for the order of magnitude, and the rule adds nothing measurable. That does not say the backtest was calculated wrongly.
Limits
- Unknown rules: we do not know the instrument, exit, leverage or EMA calculation of the backtest, and our variants are assumptions.
- Data: CFD minute data (BID), no futures, stop without slippage, fixed round trip per market. “Always long” is computed without costs in the compounding, so only the per-day lead is a fair comparison.
- One sample: one bull market. The rule's net result on the Nasdaq comes mostly from 2020 and 2026 to June (+17.9 and +18.7 bps per day), the other years lie between −1.7 and +5.3.
- Not tested: single stocks, futures, other EMA and candle lengths.
All pattern families of the scan in the overview. Related: the first candle does not predict the day, the ORB paper replicated and mistakes in AI trading strategies.
📄 Full study as PDF: 7 pages incl. all tables, figures and limits (in German).
Disclaimer: Historical statistics are no guarantee of future market behaviour. This study is not investment advice. Trading carries a risk of loss up to total loss.