Data basis: DAX, FTSE, CAC, Dow, NQ, SPX, gold, EUR/USD, GBP/USD, USD/JPY and Bitcoin; Dukascopy CFD minute data (bid), aggregated into 5-minute, 15-minute and 1-hour candles. Search period 2015–2022 (Bitcoin from May 2017), no holdout run for formations. Formations detected with a ZigZag method, stop and target by the classic rule. Costs per round trip (spread plus slippage): DAX 2.5 points, FTSE 1.5, CAC 1.5, Dow 4, NQ 2.5, SPX 0.8, EUR/USD 1.3 pips, GBP/USD 2.0, USD/JPY 1.6, gold 0.40 USD, Bitcoin 10 bps. Benchmarks: random walk (hit rate = stop ÷ (stop + target)), placebo (the ordinary candle of the same colour at the same time of day) and a random market run with identical code. No trading recommendation.
Double top, head and shoulders, triangle, wedge, channel, flag: for every formation the chart book names a price target, usually its height projected from the breakout (measured move). The rule sounds logical, and in hindsight almost any move can be explained with a formation and a target.
We test the claim itself: does price reach the target more often than a random walk would? For a random walk without drift the hit rate is stop ÷ (stop + target), as derived in the random-walk yardstick. If a formation knows something, it has to beat that. A ZigZag method finds the turning points (threshold 1, 2 or 4 ATR), and a turning point counts as known only from the candle that confirms it. The signal is the first close beyond the line within 20 candles, entry follows at the next open. Stop and target sit as in the textbook, both at least three times as far away as the median minute range, otherwise there is no trade. That gives 12,429 test variants over 22 signal types, each also on the random market (minute candles mirrored at their open with probability ½).
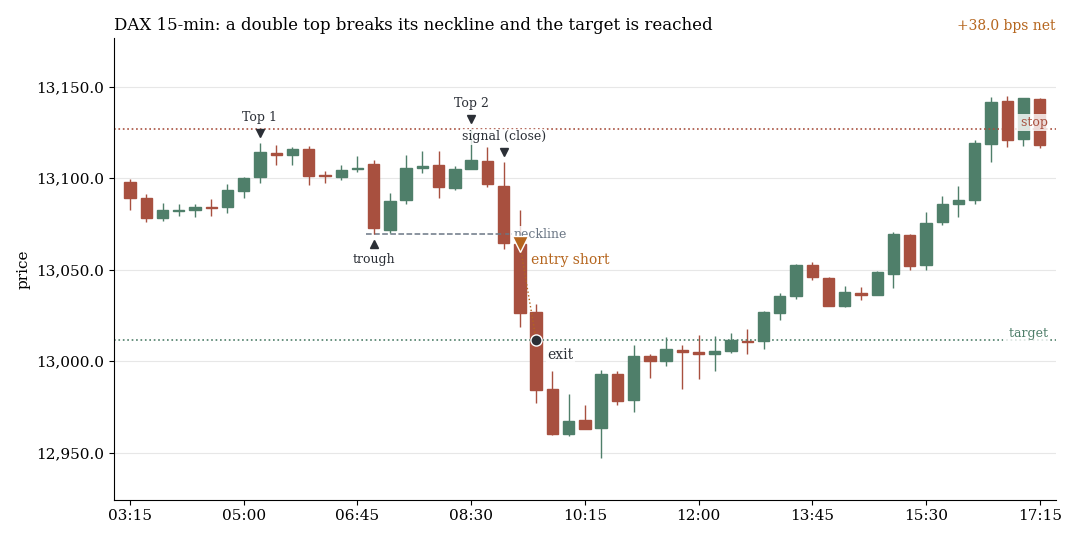
DAX, 15-minute candles, 6 Jan 2020: a double top breaks its neckline, the short reaches the target, net +38.0 bps. The four examples come from the search period 2015–2022 and were drawn at random with a fixed seed from all detected cases, not picked.
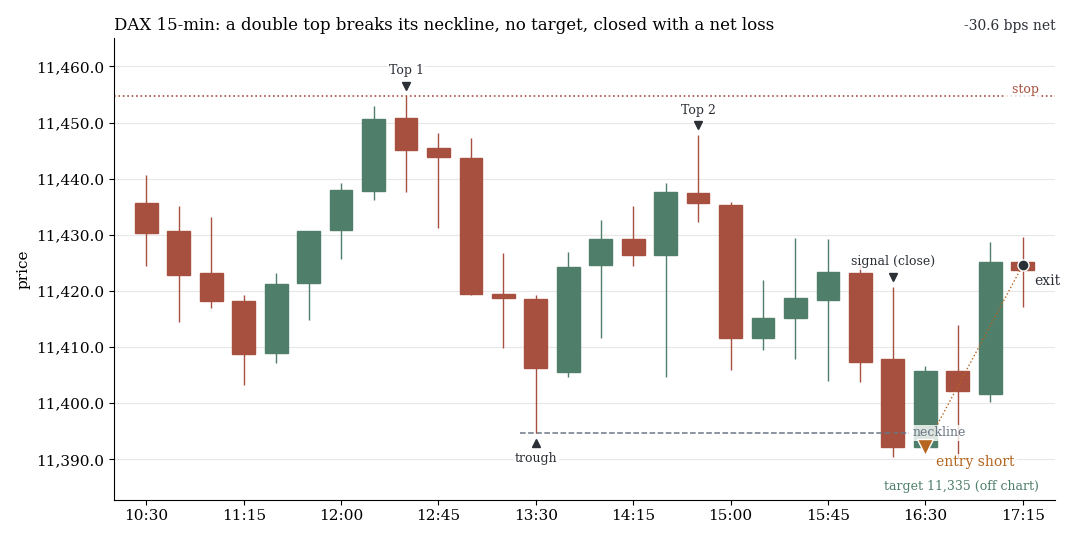
Second random example, 21 Feb 2019: neckline broken, neither target nor stop, exit at the close, net −30.6 bps.
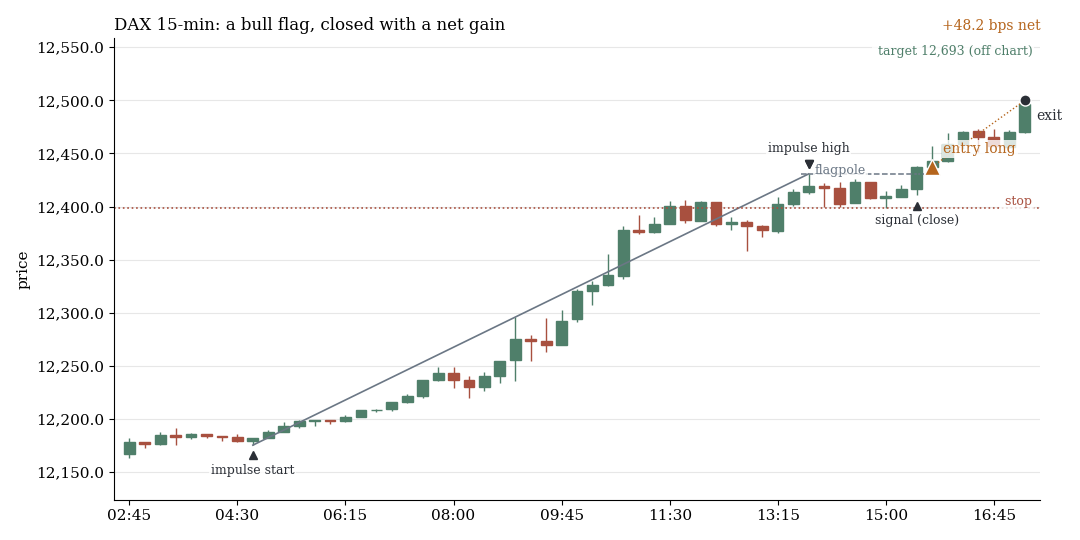
DAX, 11 Oct 2019: bull flag (flagpole, pullback, breakout), exit at the close, net +48.2 bps. The target lies outside the picture. The candle series runs on continuously over all candles with prices, as in the test, also outside the cash session.
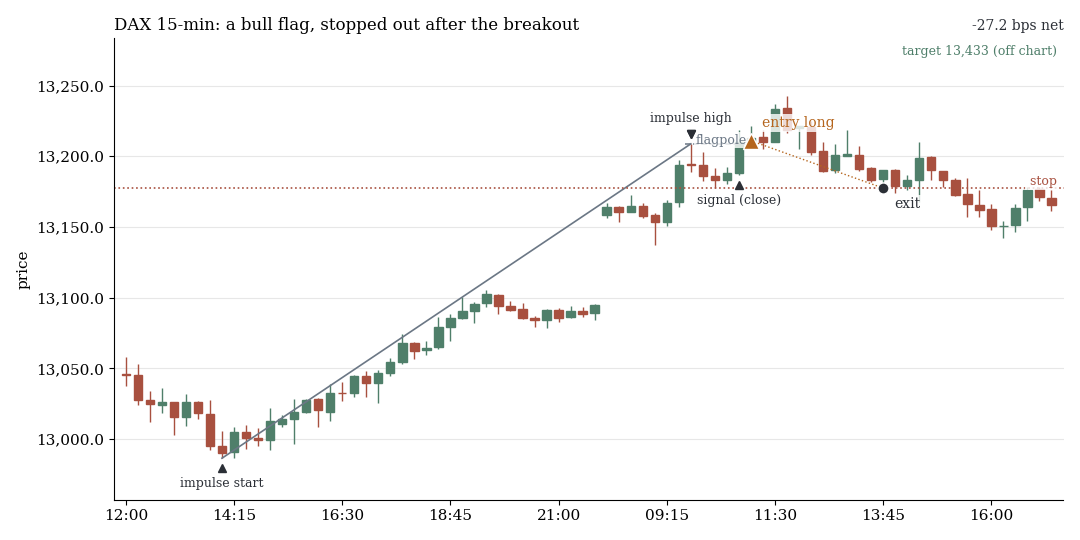
DAX, 8 Dec 2017: bull flag, breakout, then stopped out, net −27.2 bps.
1. The price target against the random walk
Across all formation types, markets, time frames and thresholds the target comes before the stop in 46.5% of about 2.9 million bracket trades. A random walk with the same distances reaches 46.8%, the random market with the formation code 46.3%.
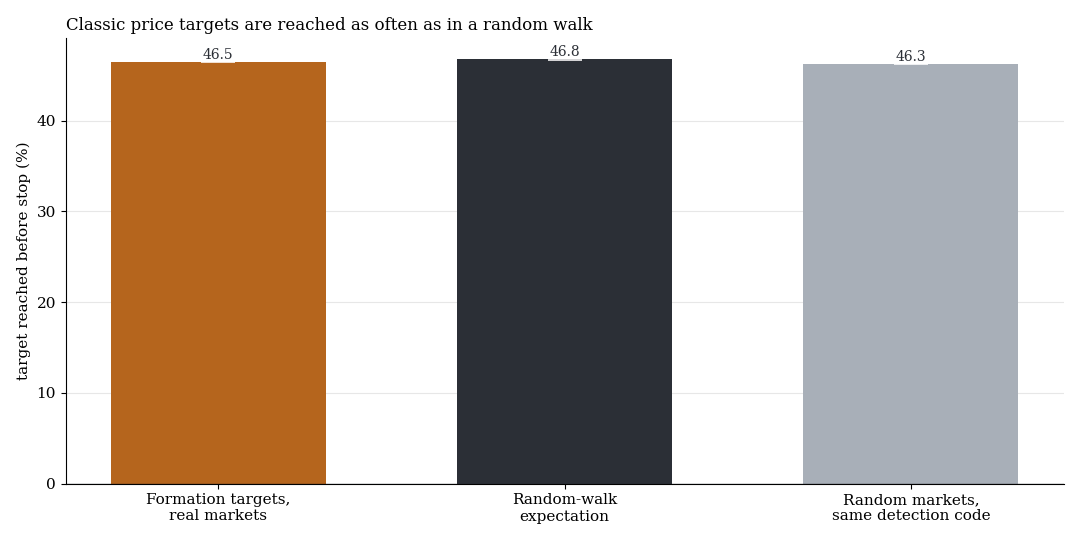
Share of trades in which the target is reached before the stop, pooled over all 22 formation types.
| Formation | Trades | Target reached | Random walk | Deviation real / random market (pp) | Net (bps) |
|---|---|---|---|---|---|
| Double top | 197,697 | 60.2% | 59.0% | +1.2 / +1.0 | −2.99 |
| Double bottom | 201,753 | 59.6% | 58.8% | +0.7 / +1.0 | −2.70 |
| Head and shoulders | 72,754 | 48.2% | 47.9% | +0.3 / −1.0 | −2.72 |
| Inverse head and shoulders | 74,570 | 46.7% | 47.5% | −0.8 / −0.3 | −2.57 |
| Trendline break up | 564,047 | 50.2% | 50.0% | +0.2 / +0.3 | −2.44 |
| Trendline break down | 546,303 | 50.5% | 49.9% | +0.6 / −0.2 | −2.71 |
| Bull flag | 25,310 | 13.0% | 20.3% | −7.2 / −5.8 | −2.85 |
| Bear flag | 16,672 | 14.8% | 21.2% | −6.4 / −5.7 | −2.97 |
For most of the 22 types the deviation from the random walk is below two percentage points (pp), and the random market shows similar deviations. Only flags stand out: they reach their flagpole target 6 to 7 pp less often than the random walk. With the same code the random market shows a shortfall of 5.7 and 5.8 pp, so it cannot be down to market behaviour.
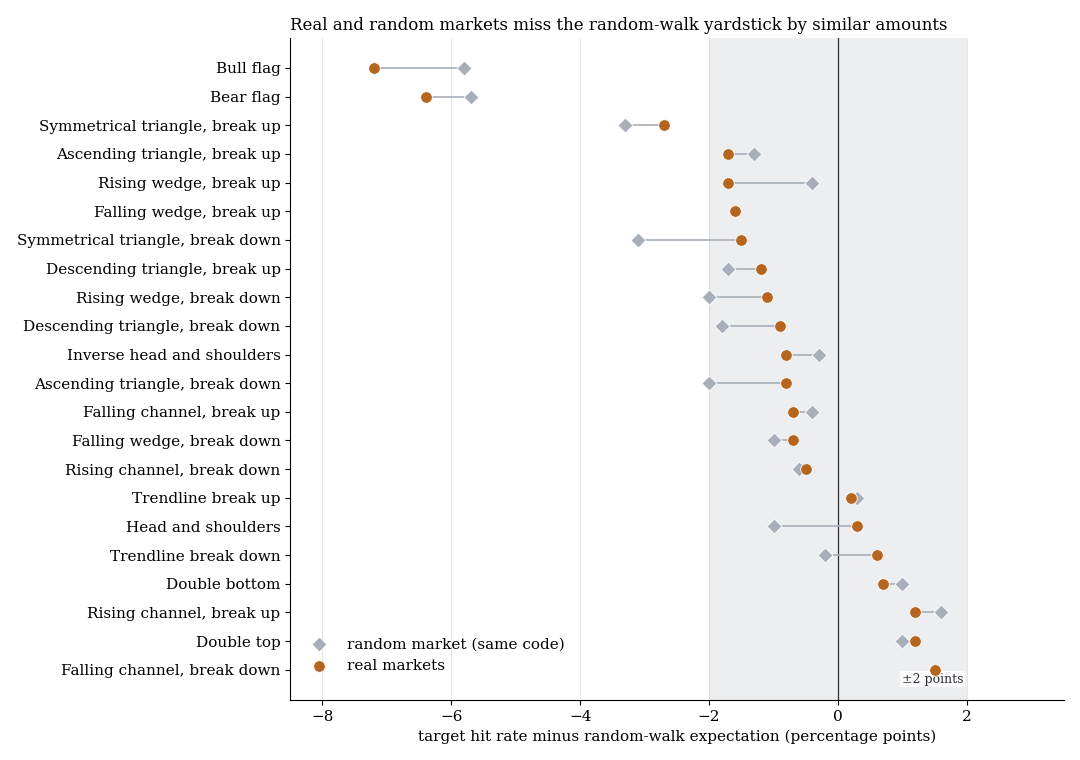
Hit rate minus random-walk expectation per formation type, percentage points. Orange: real markets, grey: random market with identical code. Shaded: ±2 points.
2. Net, every formation loses about the costs
Each of the 22 bracket types loses between −1.3 and −3.8 bps per trade on average, gross they lie between −1.0 and +1.5 bps. For comparison: a round trip in the DAX costs about 2.0 bps. Net t ≥ 3 is reached by 9 of the 12,429 tests, in the random market by none. They sit on Bitcoin (4), DAX (4) and Dow (1), the highest value is t 4.56. Two of these cases deserve a second look.
3. The DAX flag: t 3.56, eight out of eight years, and still overfitting
The strongest formation outside Bitcoin is the bull flag in the DAX (threshold 4 ATR, 15-minute candles, holding period 3 hours). It has 186 trades, +13.0 bps net, t 3.56 and is positive in all eight years. Without the five best days t 2.46 remains, a later entry (t 3.45 and 3.48) and costs raised by half (t 3.28) change little. That looks like a find.
Then the control runs. The neighbours do not carry it: threshold 2 ATR gives t −0.19, 5-minute candles t −0.41, 1-hour candles t −0.70, FTSE and CAC with the same rule t −0.42. The random market with identical code returns +10.0 bps in the first run (t 1.86, seven of eight years positive) and −4.0 bps in the second (t −1.09). After the multiple-test correction q = 1.00. This is a textbook case of overfitting: a spike instead of a plateau, found in a grid of more than 12,000 cells.
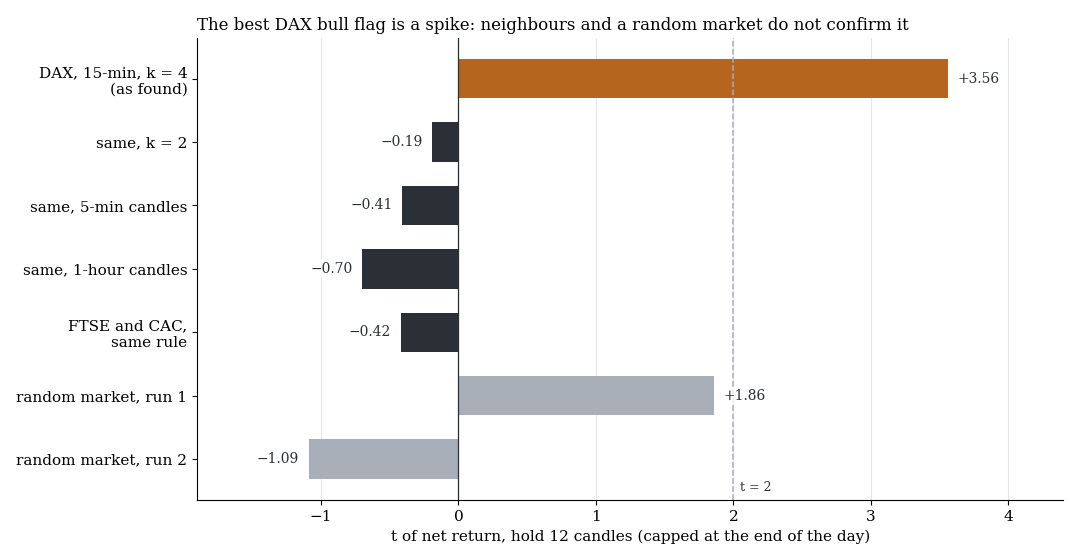
t of the net return of the DAX bull flag (orange), its neighbouring settings (dark) and the random market with identical code (grey), holding period 12 candles.
4. The Bitcoin channel is the same uptrend impulse
The highest t value of the family (4.56) belongs to a breakout from a rising channel in Bitcoin: 1-hour candles, threshold 1 ATR, long for 12 hours. It has 237 trades, +83.9 bps, is positive in all six years and lies +82.3 bps (t 4.48) above the ordinary candle of the same colour at the same time of day. The price target itself does not carry: with the measured-move bracket the rule reaches only t 1.13, on 15-minute candles t 0.46, and the random market returns −23.2 and +14.3 bps.
It is the same Bitcoin uptrend impulse as in the candlestick study, on overlapping days, so not an independent confirmation. The holdout run concerned the candlestick pattern (−11.7 bps, t −1.15). The channel itself was not tested individually in the holdout.
What it means
The projected price target hits as often as the geometry of stop and target dictates. What the target knows, a random walk knows too. Formations name swings in hindsight, and as a forecast they add nothing a random walk would not also have, according to these numbers.
The two striking rows show two familiar traps. The DAX flag is a spike in the parameter grid, which its neighbouring values and a random market already refute. The Bitcoin channel belongs to Bitcoin momentum 2017–2022 and is no independent confirmation of a formation rule.
Limits
- CFD minute data (bid), fixed cost model. Spreads of today in points, Bitcoin 10 bps. Real fills are more likely worse.
- One reading per formation. The ZigZag detection uses fixed tolerances, and anyone drawing lines by hand sees other formations. The threshold 0.5 ATR is degenerate (on the DAX 5-minute chart 95% of all candles would be turning points) and was dropped.
- Conservative simulator. If one minute candle touches stop and target, the stop counts, hence the minimum distances. There are only fixed brackets and time exits, no trailing stop.
- Pooled cases. The 2.9 million trades overlap, so the pooled hit rate has no meaningful standard error.
- No holdout for formations. All numbers come from 2015–2022. The only holdout run of the chart family concerned a Bitcoin candlestick pattern.
- One cell of 12,429. The control run shows how large chance is for the DAX flag. It does not prove that a flag never works.
- Not tested: HK50, JPN225, AUS200, SMI, daily and weekly charts.
All pattern families of the scan in the overview. Related are Fibonacci zones as a forecast, measured moves against a random market and the random-walk yardstick. The sister studies cover candlestick patterns and VWAP and indicators.
Disclaimer: Historical statistics are no guarantee of future market behaviour. This study is not investment advice. Trading carries a risk of loss up to total loss.