Data basis: DAX, FTSE, Dow, NQ and SPX in the cash session on 5-minute candles, plus gold and EURUSD as a transfer test. Dukascopy CFD minute data (BID), search period 2015–2022. There is no holdout because no candidate was left. Costs: a fixed round trip of spread plus slippage (DAX 2.5, FTSE 1.5, Dow 4.0, NQ 2.5, SPX 0.8 points), which is 0.17–0.27 R per trade. Benchmarks: the random-walk formula, random days at the same time of day and on the same side (placebo), and a random market in which every minute candle is mirrored around its open with probability ½ (same volatility, no direction, see the random market as a ruler). No trading recommendation.
Al Brooks has published a very detailed rulebook for reading candles, in his books and in his trading course. A strong trend candle with a follow-through candle sets the “always-in” state. In a trend you buy the second pullback attempt at the 20-EMA (H2, or L2 downward). Wedges and “three pushes” turn the market. And about 80% of breakout attempts from a trading range fail, so you fade them.
The rulebook is popular because every rule can be shown on a chart. A chart does not show whether a rule earns money over thousands of cases. We formalised the eight core setups in advance from Brooks' glossary and ran them against chance. That tests a mechanical translation, not the trader. Brooks trades by discretion, with context, trade management and the low costs of futures.
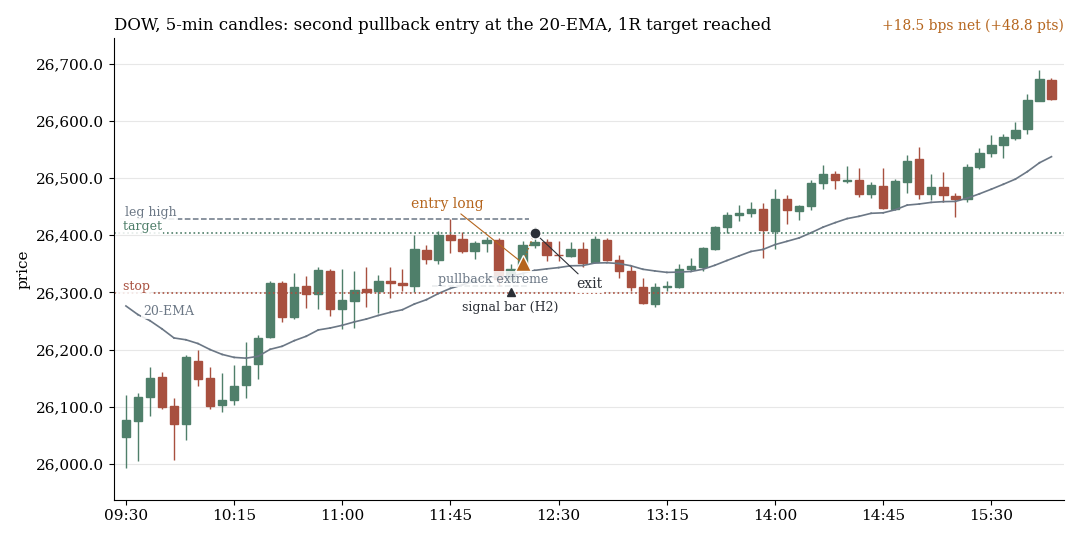
H2 at the 20-EMA in the Dow on 14 Jul 2020: buy stop one tick above the signal candle, stop below it, target 1R. The target is reached (+18.5 bps net).
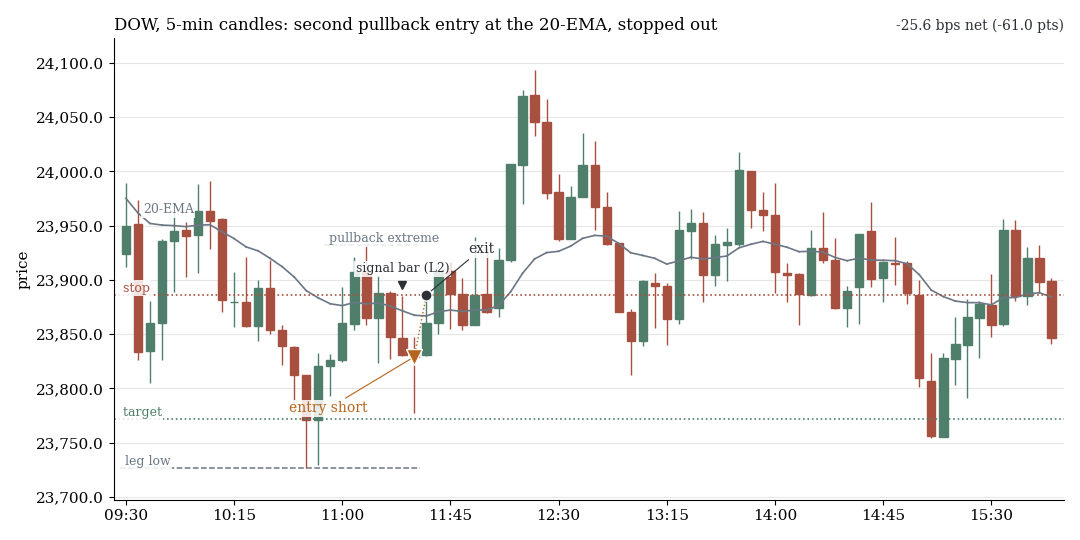
The same setup mirrored (L2) on 28 Mar 2018: the stop is hit (−25.6 bps net). Both examples come from the 2015–2022 search period and were drawn at random (fixed seed) from all 5,276 detected cases, not picked.
1. The core setup hits its target like a coin flip
In an uptrend the price pulls back, the first attempt upward (H1) fails, and on the second (H2) we buy one tick above the high of the signal candle. The stop sits below it, the target at 1R. Brooks' trader's equation requires that hit rate times reward exceeds loss rate times risk. With costs of 0.17–0.27 R per trade, a 1R scalp would need to reach its target in 59–64% of cases to pay for them. A random walk manages about 50%.
| Setup (1R target, in trend at the EMA) | n | Hit rate | Random walk | Random market | gross bps | net bps | t (net) |
|---|---|---|---|---|---|---|---|
| H1 | 4,616 | 50.4% | 50.1% | 50.5% | +0.46 | −1.95 | −6.05 |
| H2 | 5,276 | 49.4% | 50.1% | 50.6% | −0.17 | −2.57 | −9.26 |
| H3 and later | 22,391 | 51.4% | 50.1% | 51.4% | +0.53 | −1.84 | −11.68 |
H2 is no better than H1 or H3+. It is also no better than an arbitrary stop entry on the same side at the same time of day: the placebo differences all lie within ±1.5 bps. None of the 125 pullback-count variants is net positive, the best t is −0.22. Every trade loses the costs on average.
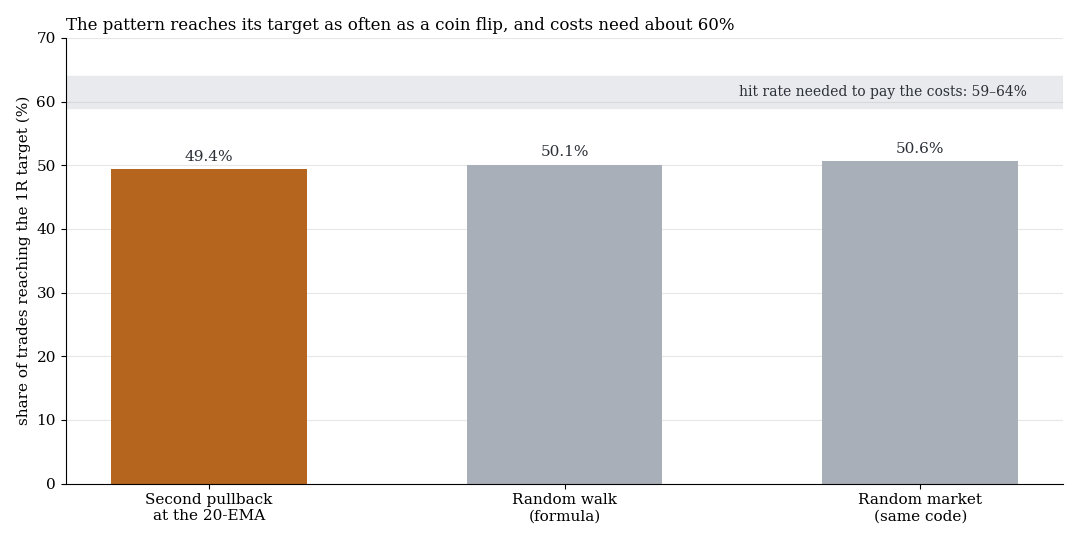
Hit rate of the core setup (n = 5,276) against the random-walk formula and the random market. The grey band is the hit rate needed after costs.
2. The 80% rule describes chance
Brooks' best-known number: about 80% of breakout attempts from a range fail. We count an attempt when the high exceeds the high of a narrow range over the last 12 or 24 candles. It failed if the close is back inside the range within six candles.
| Group | Range | n attempts | fail (real) | fail (random market) | Difference | t |
|---|---|---|---|---|---|---|
| EU (DAX, FTSE) | 12 candles | 28,697 | 80.3% | 80.3% | −0.05 pp | −0.13 |
| EU | 24 candles | 14,860 | 80.4% | 80.4% | +0.02 pp | 0.05 |
| US (Dow, NQ, SPX) | 12 candles | 31,784 | 79.1% | 80.4% | −1.3 pp | −3.20 |
| US | 24 candles | 14,045 | 78.3% | 81.3% | −3.1 pp | −5.22 |
| All | 12 candles | 60,481 | 79.7% | 80.4% | −0.7 pp | −2.55 |
| All | 24 candles | 28,905 | 79.4% | 80.9% | −1.5 pp | −3.89 |
Brooks hit the number exactly. But it is the number of a random walk: the random market also gives 80.3% in DAX and FTSE. In the US indices, breakouts fail even less often than in chance, so slight continuation, the opposite of the Brooks thesis. Fading the failed breakout (target: middle of the range, 12-candle range) hits 57.5% against 56.2% for the random walk and 56.0% for the random market. Net that leaves −0.5 to −2.2 bps, the best t is −0.92.
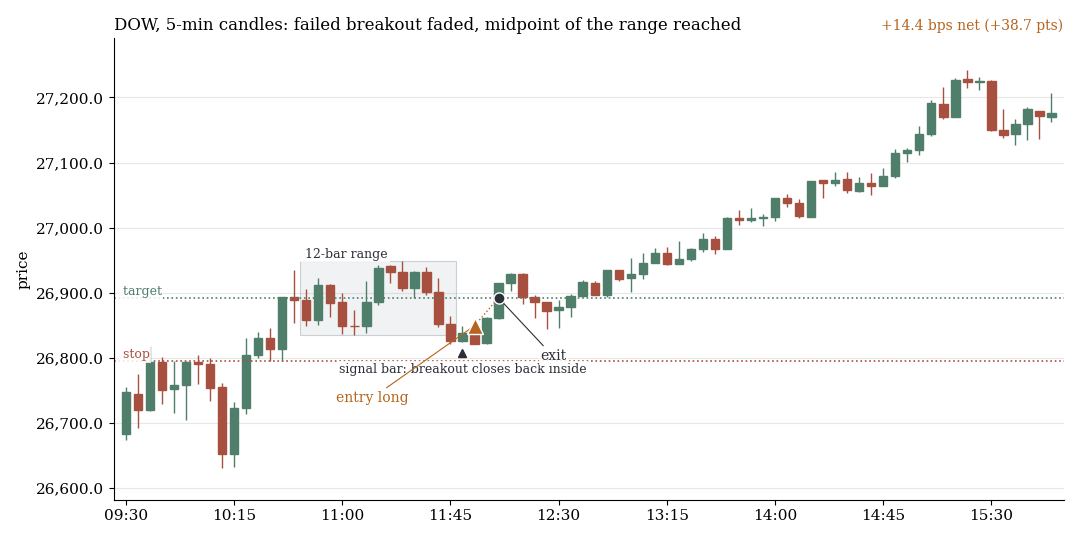
Failed breakout to the downside in the Dow on 25 Sep 2020 (12-candle range): the price closes back inside the range, we buy above it, and the range midpoint is reached (+14.4 bps net).
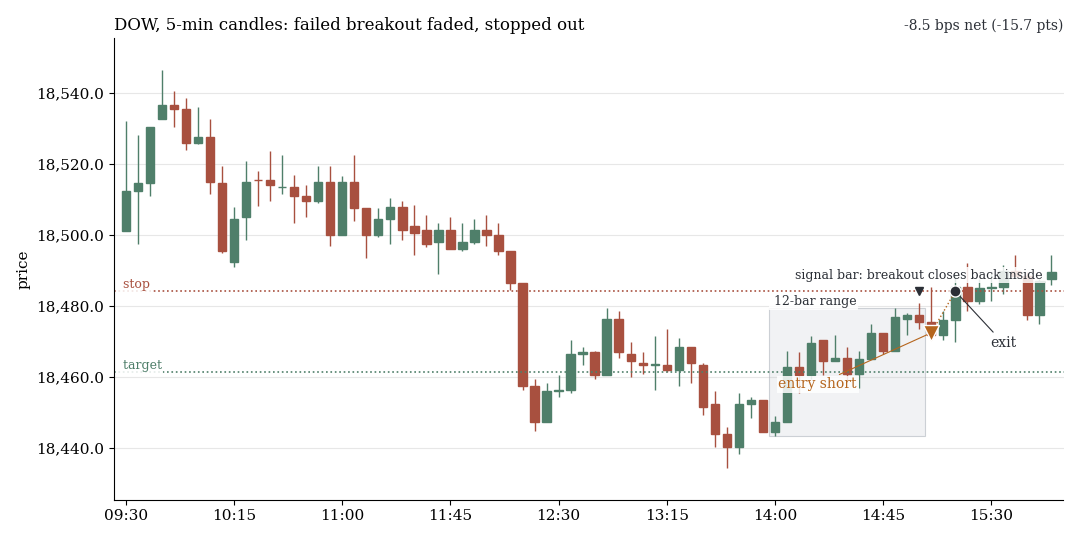
Failed breakout to the upside on 2 Sep 2016: the sell is stopped out (−8.5 bps net). These examples too were drawn at random with a fixed seed from all 9,301 detected cases of the search period.
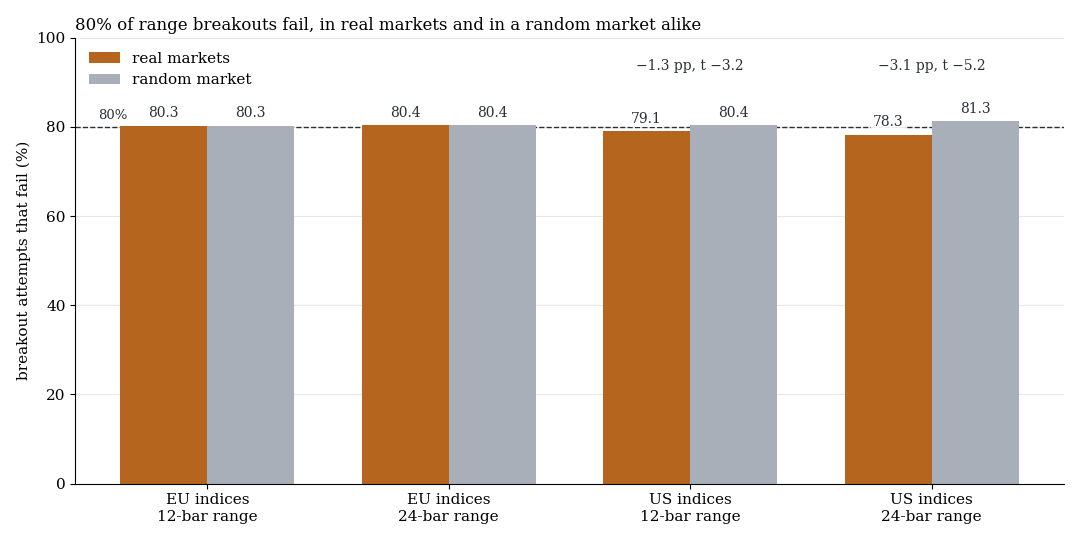
Share of breakout attempts that fail: real markets (orange) against the random market (grey).
3. The other setups sit at placebo level
| Setup | Hit rate (1R) vs random market | Result after costs |
|---|---|---|
| Strong trend candle with follow-through (always-in) | no prediction for the next 30/60 minutes | gross +0.02 / +0.13 bps (n 30,752) |
| Wedge / three pushes in a trend | 51.4% vs 51.0% | −1.6 to −2.4 bps |
| Breakout pullback | 52.1% vs 51.7% | −1.3 to −2.2 bps |
| First EMA touch after 20 gap bars | 45.1% vs 45.2% (test of the extreme) | best t 0.67 |
| ii / iii | 50.9–51.2% vs 50.5–51.2% | −1.6 to −3.7 bps |
| Final flag | 49.3–49.9% vs 50.6–50.8% | −1.3 to −2.6 bps |
| Trend from the open | best row of the test: US alone +5.69 bps (t 1.51) | all markets +2.19 bps (t 0.79), without the five best days −0.03 bps |
| Gold and EURUSD (714 rules) | transfer test | best t 0.89 |
Two findings are real but small. The always-in state at midday predicts the rest of the day slightly: +3.37 bps gross, +0.88 bps net (t 0.90) against 2.48 bps of costs. And the first break of a micro channel does fail more often than by chance: 52.2% against 50.7%, gross +1.0 to +1.7 bps against 2.4 bps of costs. The direction is right, the size is not enough.
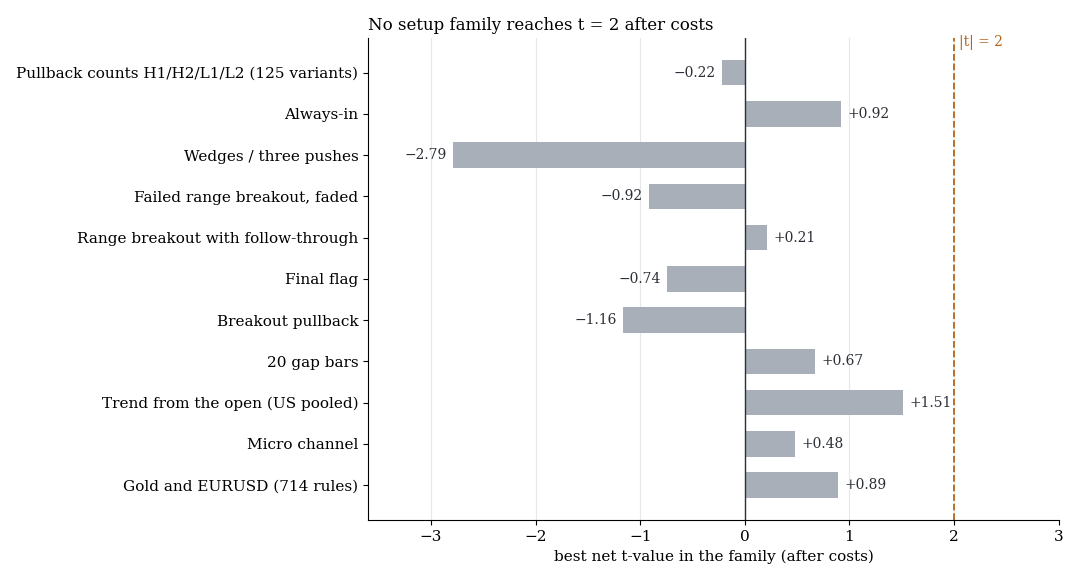
Best pooled net t per setup family. The orange line marks |t| = 2. The highest value of the whole test is 1.95 (trend from the open, NQ alone).
What it means
The patterns can be programmed cleanly, but they carry no expectancy. Across 3,586 trading rules there is no hit, and the only eight hits of the multiple-testing correction sit in the descriptive rates and all point against Brooks. What stays useful is his way of thinking: the trader's equation works if you measure the hit rate against the random walk instead of against gut feeling.
What makes Brooks himself profitable, we cannot measure with this data. Not reproducible here are the choice of days and the judgement in context, order book and order flow, the lower costs of futures and the selection of survivors among traders. Even at zero cost the gross results (mostly 0 to +1.5 bps) would not be distinguishable from the placebo. If his advantage lies in judgement, it does not transfer as a rule.
Limits
- CFD minute data (BID), not futures. Costs are fixed, real fills are more likely worse.
- The formalisation is a selection. For each setup, 2 to 5 parameter variants were fixed in advance from the glossary. Brooks reads discretionarily.
- Tick-exact scalps cannot be tested. For 52–60% of signal candles the stop was tighter than three times the median minute range and was widened to that width.
- Not tested: tick and order book data, time frames other than 5 minutes, trade management (trailing the stop, partial profits), combinations of several setups, daily and weekly charts.
- Small subsets: for iii (n 278–582) there are too few cases to say more.
- Search period 2015–2022 only. There was no candidate, so no holdout run.
All pattern families of the scan in the overview. Related: the random-walk yardstick, breakouts: only the close counts and late breakouts after an early whipsaw.
Disclaimer: Historical statistics are no guarantee of future market behaviour. This study is not investment advice. Trading carries a risk of loss up to total loss.