Data basis: DOW, NQ and SPX (pooled as US indices), DAX, FTSE, JPN225, gold, EURUSD and USDJPY; Dukascopy CFD minute data (BID). Search period 2015–2022, one candidate in the separate holdout 2023 to 5 June 2026. Public series (VIX family, AAII, put/call, geopolitical risk GPR, policy uncertainty EPU, news sentiment, NFCI, earnings surprises of 31 mega caps, weather, moon phases), used only from their assumed availability date. Costs as a round trip of spread and slippage (DAX 2.5 points, NQ 2.5, Dow 4, SPX 0.8), time exits. Benchmarks: a random market with identical code (every minute candle mirrored at its open with probability ½), placebo on random days, the drift “always long”. Directions and thresholds were fixed from the literature before any return was computed. No trading recommendation.
“Buy when there is fear.” This is the best-known form of market psychology: fear overshoots, extremes reverse, sentiment indicators are contrarian, and after geopolitical shocks the dip is worth buying. Many of these rules have published support (Simon and Wiggins 2001, Fisher and Statman 2000, Tetlock 2007).
We tested every rule as the literature describes it, with the direction fixed in advance, so nothing can be bent afterwards. Result: none holds intraday, and the random market produces more strong results than the real data.
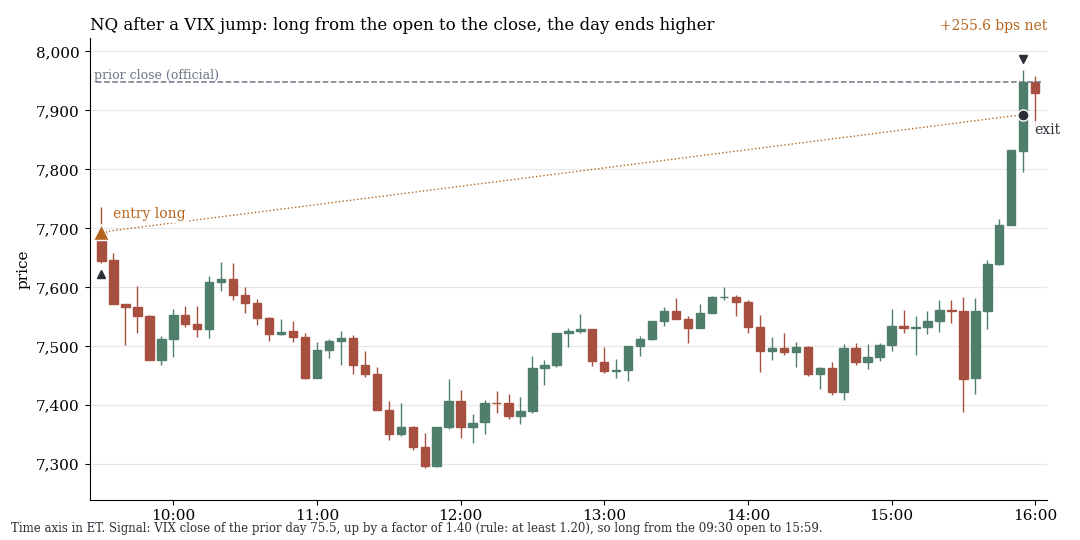
NQ in 5-minute candles, ET. The VIX rose by a factor of 1.40 the day before (rule: from 1.20), so the rule buys at the open and sells at 15:59. Result: +255.6 basis points net.
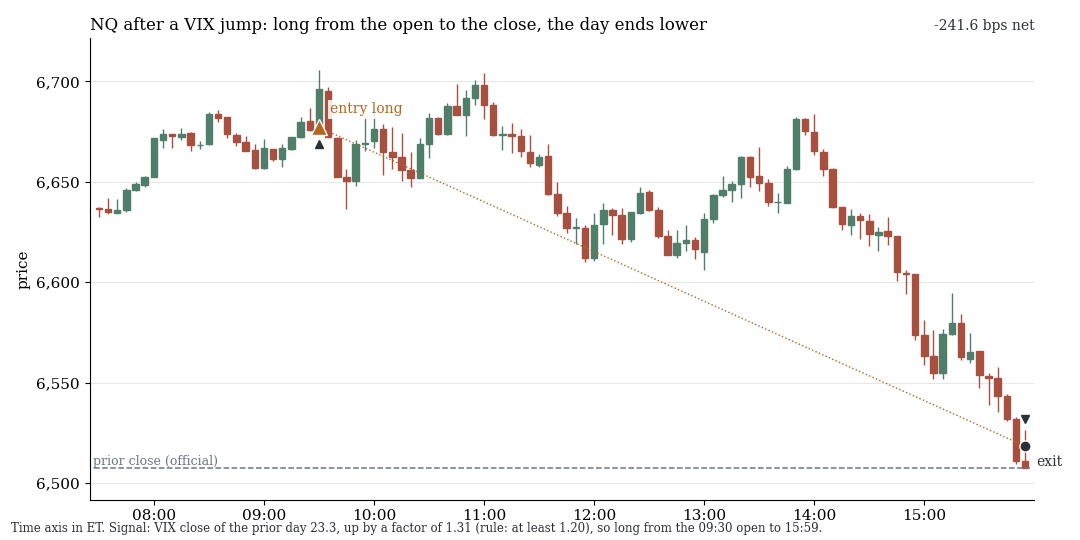
Same rule, a losing case: −241.6 basis points net after a VIX jump by 1.31. Both cases come from 2015–2022 and were drawn at random from all detected cases with a fixed seed, not picked.
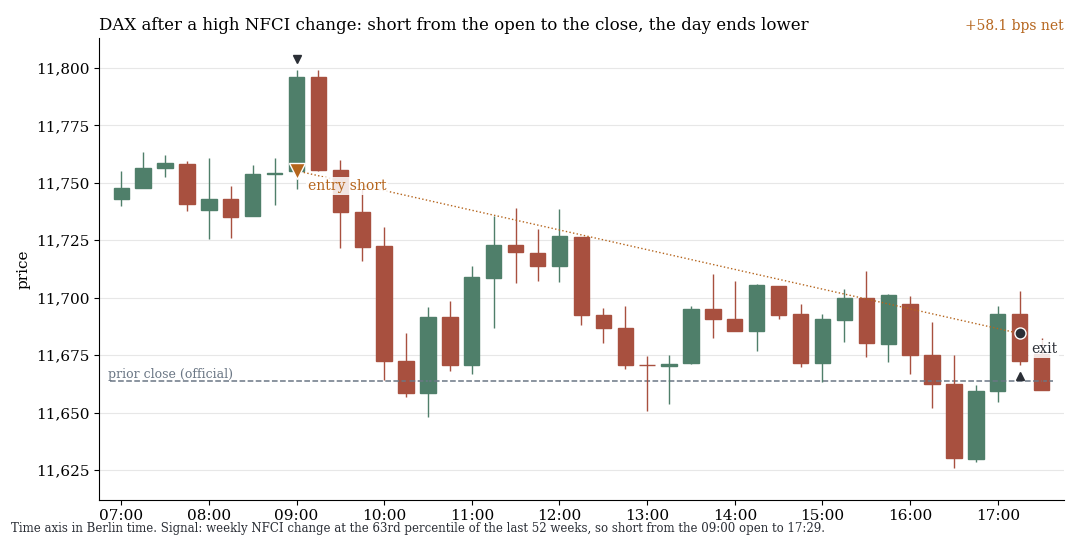
DAX in 15-minute candles, Berlin time. The weekly NFCI change sits at the 63rd percentile of the last 52 weeks, so the rule is short from 09:00 to 17:29. Result: +58.1 basis points net.
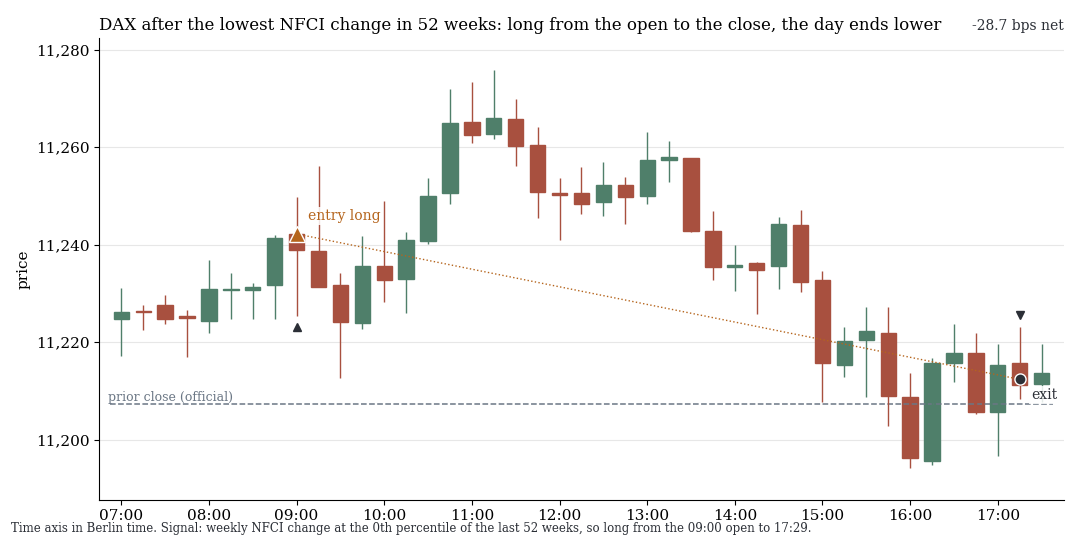
A losing case of the same rule: the lowest NFCI change of 52 weeks, so long, and the DAX closes lower (−28.7 basis points net). Also drawn at random.
1. None of the pre-registered hypotheses holds
327 trading rules with a time exit. The best positive t after costs is 2.12. The table shows the primary threshold of each hypothesis for the US indices, open to close.
| Hypothesis (direction fixed in advance) | US indices, net basis points (t) |
|---|---|
| VIX jump of 20% or more → long | +8.9 (0.45), 54 days |
| VIX above the 3-month VIX → long | +11.0 (0.83) |
| AAII sentiment / put/call extremes, contrarian | +1.8 (0.45) / −3.9 (−0.34) |
| Geopolitical risk (GPR) → long | +4.6 (0.61) |
| GPR acts instead of threats → long | +15.7 (2.12), without the 5 best days t 1.05 |
| Uncertainty (EPU, threats, other measures) → long | all t at most 1.2 |
| Earnings surprise of mega caps → reversal | +0.2 (0.04) |
| Overreaction after a 2-sigma day → fade | +8.4 (0.85) |
| Monday after the clock change → short | −26.0 (−1.60), 14 days |
| Sun (cloud cover) / moon phases | −3.3 (−1.27) / −4.0 (−1.99), gross t below 1 |
| Financial-stress regime switches trend or reversal | differences with t at most 2.28 |
| Media pessimism → short | −17.7 (−3.43), reversed |
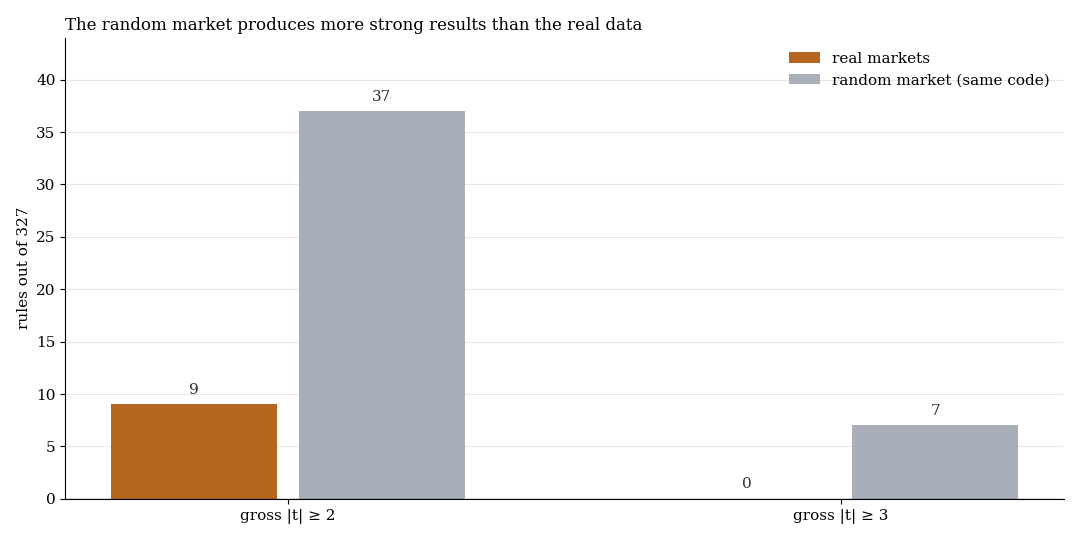
Trading rules with gross absolute t of 2 or more and of 3 or more, real markets against the random market. From t 3 no real rule of 327 qualifies, on the random market 7 do.
The one positive rule, GPR acts, hangs on a few days and drops to t 1.30 and 1.50 at the neighbouring thresholds. The breadth scan (1,620 cells) finds barely more than chance: from t 3, 7 real cells against 5, 4 and 2 on three random markets (expectation about 4.4), four of them NFCI sub-indices.
2. Media pessimism: the effect depends on the publication lag
According to Tetlock, media pessimism is followed by price pressure. In our data the US indices tend to rise on the same day after low news sentiment (lowest decile), the opposite. The San Francisco Fed index is updated only weekly, so treating it as known on the newspaper day is the optimistic case.
| When is the index known? | net basis points | t | positive years |
|---|---|---|---|
| on the newspaper day (optimistic) | +12.2 | 2.35 | 7 of 8 |
| 3 days later | +3.5 | 0.70 | 5 of 8 |
| 7 days later | +8.5 | 1.67 | 7 of 8 |
With a lag of three days the effect collapses. We also flipped the direction after looking at the data, so it does not count as a find.
3. The NFCI candidate: passed locally, not globally
The Chicago Fed's NFCI measures financial conditions. If the weekly change lies above the median of the previous 52 weeks, the DAX is traded short on the cash day (open to 17:29), otherwise long. Discovery: n 2,008 days, +7.0 basis points net (t 3.23), 6 of 8 years positive, without the five best days t 2.79. On random markets t is −1.4, −0.6 and +0.3. Holdout (one run, n 857): +5.29 basis points net, t 1.98, one-sided p 0.024. After the global correction across all holdout tests of the scan, q stays at 0.15 (threshold 0.10).
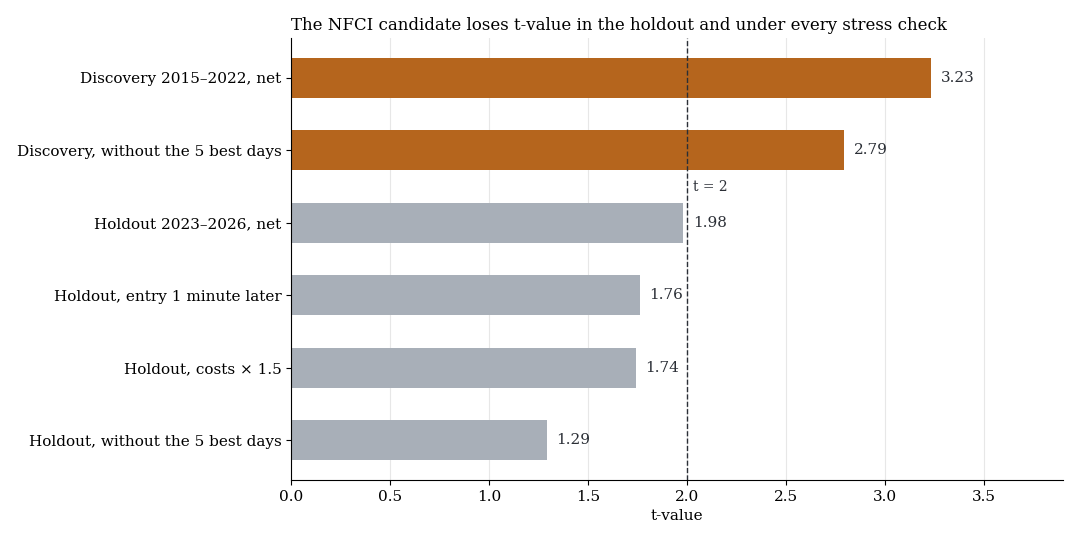
t-values of the NFCI candidate from discovery to holdout and under stress checks. Orange: t of 2 or more.
In favour: all four holdout periods are positive and a random-direction placebo is clearly beaten. Against it: the holdout is close (without the five best days t 1.29). Only Europe carries it (DAX and FTSE pooled +4.2 basis points, t 2.25; US indices +0.4, t 0.18) although the NFCI is a US index. And the NFCI is re-estimated backwards every week, so we only have today's final values. The effect already shows before publication (IC −0.089, t −2.62). The persistence of the signal explains that (autocorrelation 0.945), so it proves no lookahead, but it shows a heavily smoothed series. Market proxies with the same timing deliver nothing (VIX weekly change IC +0.025, HYG/LQD IC 0.001). A check with the values published at the time is outstanding. Revision lookahead is neither proven nor ruled out.
What it means
Market psychology from public data offers no tradeable intraday edge in 2015 to 2022. Most rules sit at zero gross and turn red net of costs, and “buy fear” is a coin flip as a daily rule. That random markets beat the real data in strong results shows how many hits chance alone produces. The only find that passes a holdout locally uses a series revised backwards, and only real-time values can settle whether that explains it. Until then it is a lead, not a setup. One pattern of the scan passed, the index rebalancing dates.
Limits
- CFD minute data (BID), fixed cost model. Real fills are likely worse.
- Intraday only. Many literature findings concern daily or multi-day returns including overnight. Not found intraday does not mean wrong on a daily basis.
- Availability. News indices (GPR, EPU, news sentiment) use the newspaper date, NFCI and the stress index the latest final values instead of real-time values.
- Small samples. VIX jump 54 days, clock change 14, weekend GPR 9. Earnings only from 31 of today's mega caps (survivorship). FX and gold only in the London window.
- Discovery against holdout. Only the NFCI candidate ran in the holdout, and its weekly signal is slow: far fewer independent observations than n 857.
All pattern families of the scan in the overview. Related: post-mortem of four features with lookahead and trend days need no catalyst.
Disclaimer: Historical statistics are no guarantee of future market behaviour. This study is not investment advice. Trading carries a risk of loss up to total loss.