Data basis: DAX, FTSE, NQ, SPX, Dow, HK50, JPN225 (from 2018), gold, EURUSD, USDJPY; Dukascopy CFD minute data (BID). 83,717 rows (market × decision time × day), 98 lookahead-free features (intraday path, neighbouring markets, public daily data, calendar and event dates), 79 combinations of market, time and horizon (60 minutes or until the close). Walk-forward with an expanding training window, test years 2018–2022, one day of embargo. Search period 2015–2022, holdout 2023 to June 2026 only for the one distilled rule. Costs: spread plus slippage per market, round trip 1.2 to 4.7 bps. Benchmarks: random market (every minute candle randomly mirrored: same volatility, no direction) and targets shuffled across days. No trading recommendation.
“AI finds patterns that humans miss” is the most common expectation of machine learning in trading. It has a true core: models weigh many features at once and can find interactions. It has a problem: financial data have a very small signal-to-noise ratio, and any flexible model finds something in noise.
We tested it with the two most robust standard methods, strong regularisation and a comparison against markets with no pattern. In the end one rule was left, and we tested it in the holdout.
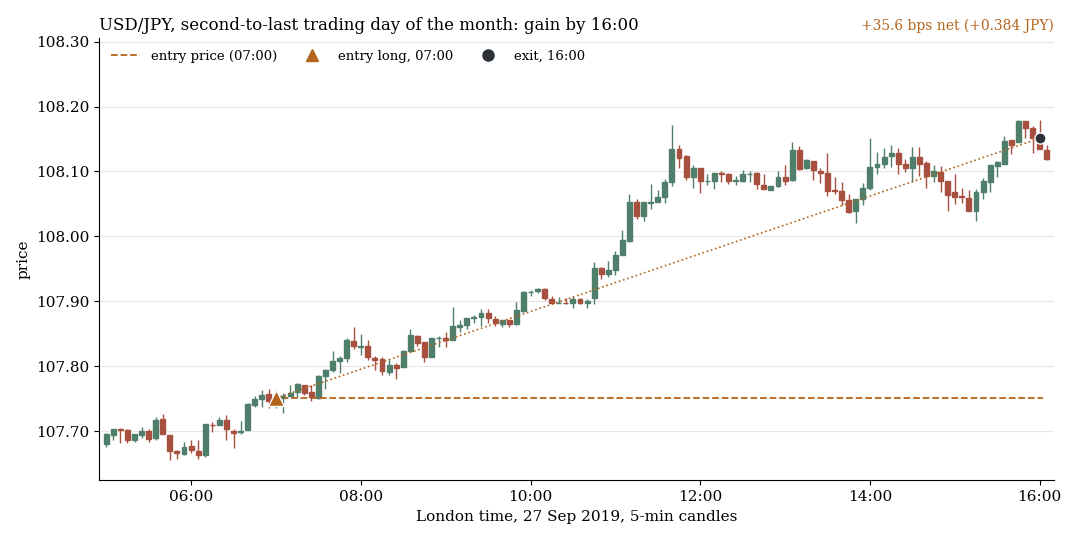
The one rule the scan left standing: USDJPY long from 07:00 to 16:00 London time on the last three trading days of the month, with no signal and no filter. 27 September 2019 (second-to-last trading day): +35.6 bps after costs.
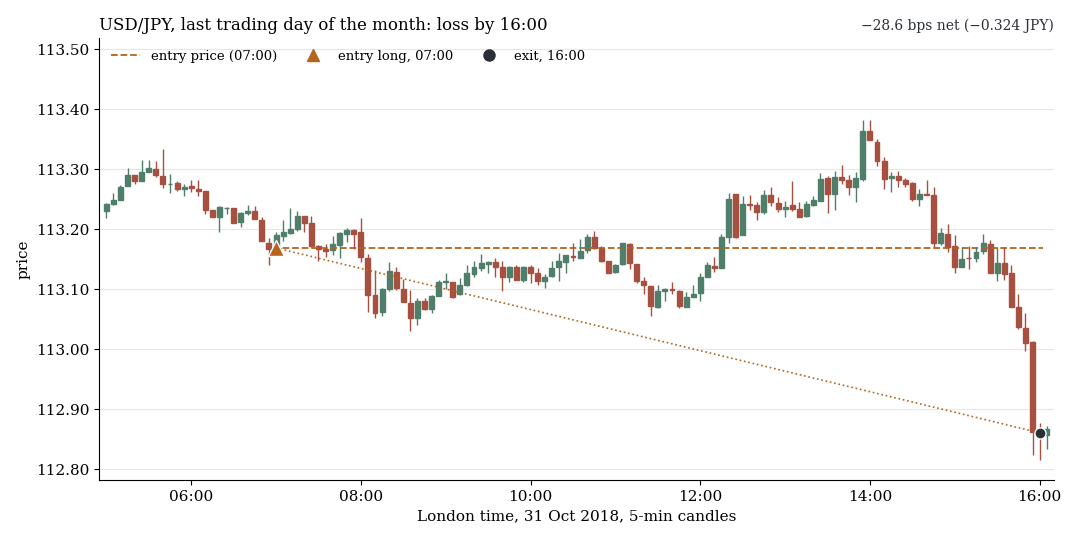
31 October 2018 (last trading day): −28.6 bps after costs. Both examples come from the 2015–2022 search period and were drawn at random from all trading days of the rule with a fixed seed, not picked.
1. One feature at a time: weak but real structure
Before the model comes the simple scan: 6,921 tests, each one feature against the return of one market at one time (rank correlation, also called information coefficient or IC). It finds more strong cells than the random market: |t| > 3 in 50 tests, on the random market in 20, and 18.7 would be expected by pure chance. Six hits survive the multiple-testing correction (random market: 0), and their IC is 0.09 to 0.10. So there is structure, but it is small.
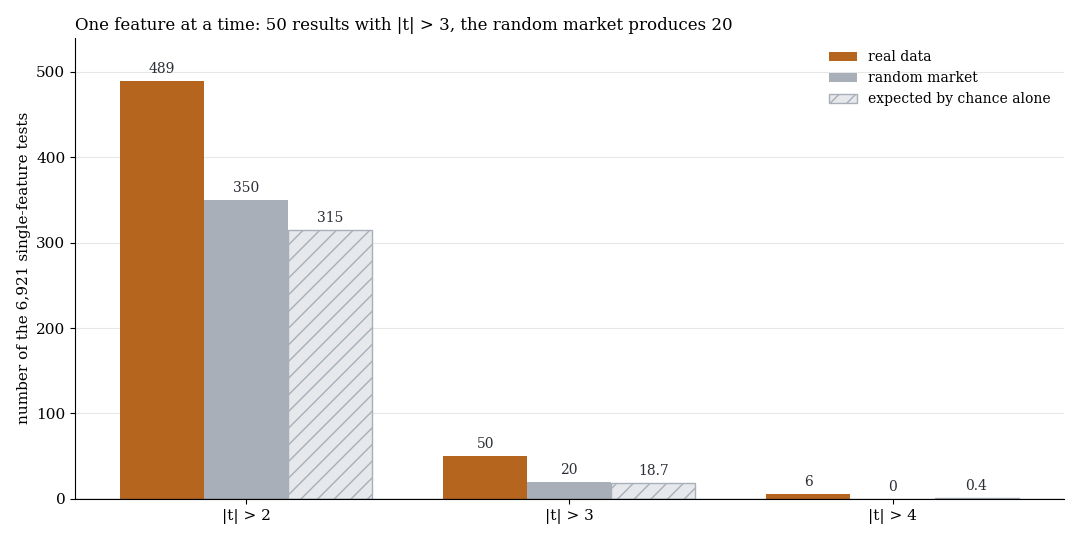
Number of the 6,921 single-feature tests with |t| above 2, 3 and 4 on real data (orange), on the random market (grey) and expected by pure chance (hatched).
2. Ridge and XGBoost: above the random market, but near zero
The models: ridge regression and shallow XGBoost (depth 2, 150 trees) on all 98 features, target is the return divided by the ATR of the last 20 days. Training grows year by year, testing runs 2018 to 2022 with one day of embargo. A trade is taken when the absolute prediction is above the median of the predictions in the training window.
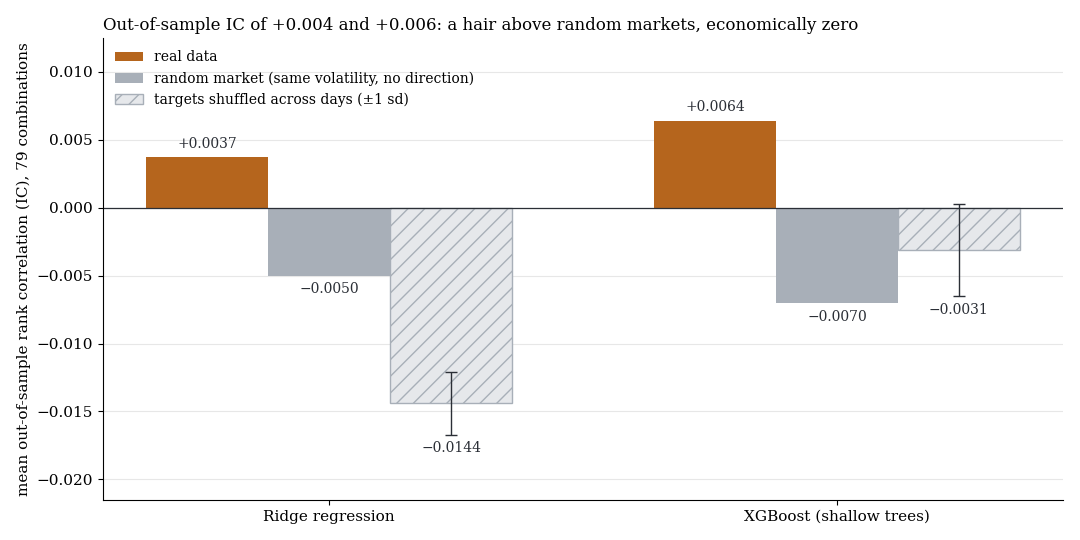
Mean out-of-sample IC over 79 combinations. Orange: real data. Grey: random market with an identical pipeline. Hatched: targets shuffled across days (error bars: one standard deviation over the repetitions).
| Ridge | XGBoost | |
|---|---|---|
| mean out-of-sample IC | +0.0037 | +0.0064 |
| random market, same pipeline | −0.0050 | −0.0070 |
| targets shuffled across days | −0.0144 | −0.0031 |
| z against the random market (79 combinations / effectively 40 independent) | 2.6 / 1.8 | 4.4 / 3.1 |
| model rule, net per trade on average | −1.37 bps | −1.64 bps |
| combinations with net above zero | 16 of 79 | 15 of 79 |
| combinations with net t above 2 | 0 | 0 |
The IC is measurably above the random-market null, which is the remainder of the real structure from the single-feature scan. Economically a rank correlation of 0.004 is nothing: the trading rule on the predictions loses 1.4 to 1.6 bps per trade on average, and none of the 79 combinations reaches net t > 2. The best cells are US indices in the last trading hour (SPX with XGBoost IC +0.082, NQ with ridge +0.066), but net only +0.8 to +2.2 bps at t below 1.3.
For gold from 13:30 to 14:30 London time both models were systematically the wrong way round: IC −0.09 (ridge) and −0.11 (XGBoost), negative in all five test years, and the model rule loses 6.7 bps per trade (t −5.06). The cause is unexplained. Flipping the model would be after the fact and no test. Reading: the machine learning only confirms what a single feature already shows and finds no tradeable interaction.
3. The distilled rule: zero in the holdout
From the scan hits we distilled simple rules. The strongest is the one from the examples above: USDJPY long from 07:00 to 16:00 London time on the last three trading days of the month, with no signal.
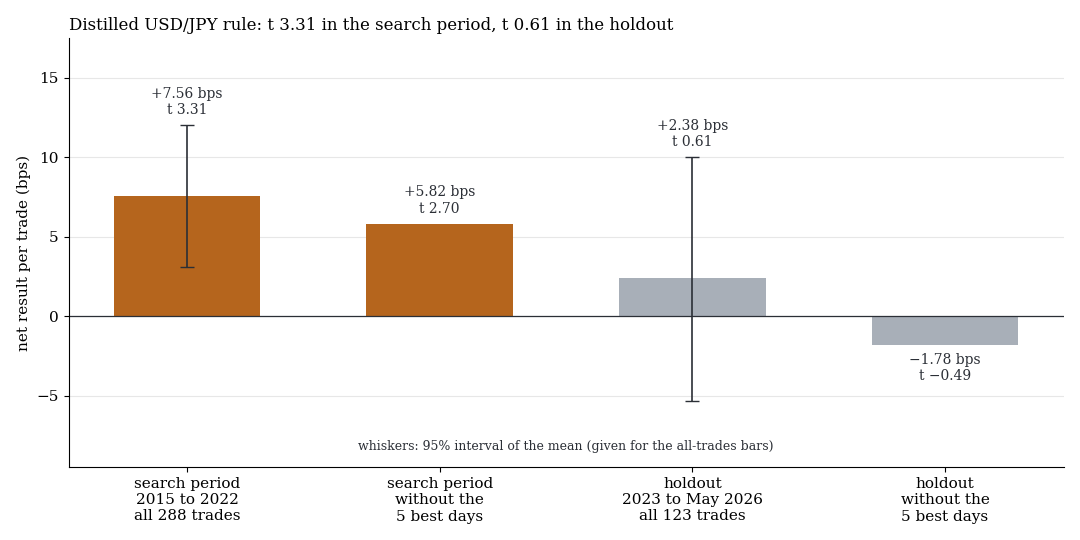
Net result per trade of the rule in the search period (orange) and in the holdout (grey), each with all trades and without the five best days, t-value above. Error bars: 95% interval of the mean.
Search period: 288 trades, +7.56 bps net (t 3.31), seven of eight years positive, both halves +7.5 and +7.7 bps, random market −1.8 bps. At q = 0.18 the rule misses the multiple-testing correction over the 7,343 tests of the scan.
Holdout, one run: 123 trades in 41 months, +2.38 bps (t 0.61, p = 0.27), 95% interval −5.3 to +10.0 bps. Without the five best days −1.78 bps, only two of four years positive, and a placebo (mid-month, +3.7 bps) is above the rule. At 1.5 times the costs it is +1.84 bps (t 0.47).
The holdout cannot refute the rule (power at most 62%, even if the full search-period effect were real), but it does not support it either. The point estimate shrinks to a third, as expected for a find selected from 7,343 tests.
What it means
Machine learning is no magic here. On 98 features and 79 combinations a rank correlation of 0.004 to 0.006 remains, and it is smaller than the costs. The model confirms the single features and finds no tradeable interaction. That does not mean ML never helps. It means that with these minute data, these features and these models it brings no tradeable edge. The second lesson is search breadth: a scan with 7,343 tests always delivers a nice t-value (3.31), and in the holdout it falls to 0.61. That is what the holdout is for.
Limits
- CFD minute data (BID), fixed cost model. Round trip 1.2 to 4.7 bps, real costs are likely higher. Tick volume is zero over long stretches and is only of limited use as a feature.
- Simple ML design. Fixed, strong regularisation, no hyperparameter search, only five test years. Not tested: elastic net, pooling across markets, other trading thresholds, deeper models, neural networks.
- Small sample. The rule has 36 trades per year, the holdout 123 trades. “Not confirmed” does not mean “proven zero”.
- Selection. The rule was selected from 7,343 tests, so t 3.31 is biased by selection. A second observation of similar strength (94 event days) did not go into the holdout.
- One holdout for one rule. The design cannot find patterns that only emerged from 2023 on. That was the price for a clean holdout.
All pattern families of the scan in the overview. Related: AI in trading: reality versus hype, mistakes in AI trading strategies, lookahead bug postmortem, brute-force search against random markets.
Disclaimer: Historical statistics are no guarantee of future market behaviour. This study is not investment advice. Trading carries a risk of loss up to total loss.