Data basis: DAX, FTSE, Dow, NQ, SPX, gold, EURUSD, USDJPY; Dukascopy CFD minute data (BID), decision times every 15 minutes. Rule = condition (one building block or two from different families, 136 blocks in total from time of day, weekday, calendar, VIX, dollar index, yields, sentiment indices, event dates, price path and neighbouring markets) plus exit (15, 30, 60, 120 minutes or the close) plus direction: 732,000 rules nominally, 681,882 evaluated. Search 2015–2019, confirmation 2020–2022, holdout 2023 to June 2026 only for the one flagged rule. Costs: spread plus slippage per market, round trip 1.2 to 3.4 bps. Benchmark: the same search on 20 random markets (every minute candle randomly mirrored: same volatility, no direction). No trading recommendation.
“Search long enough and you will find something” is the reflex of many backtests, and it works: some combination of time of day, volatility and weekday always shows a nice t-value. The question is not whether a search finds something. The question is whether the find is better than what the same search finds on a market with no pattern. That is the idea of White’s reality check (2000) and Hansen’s SPA test (2005).
We ran it: 136 building blocks, eight markets, about 682,000 rules, and the same search once more on 20 random markets.
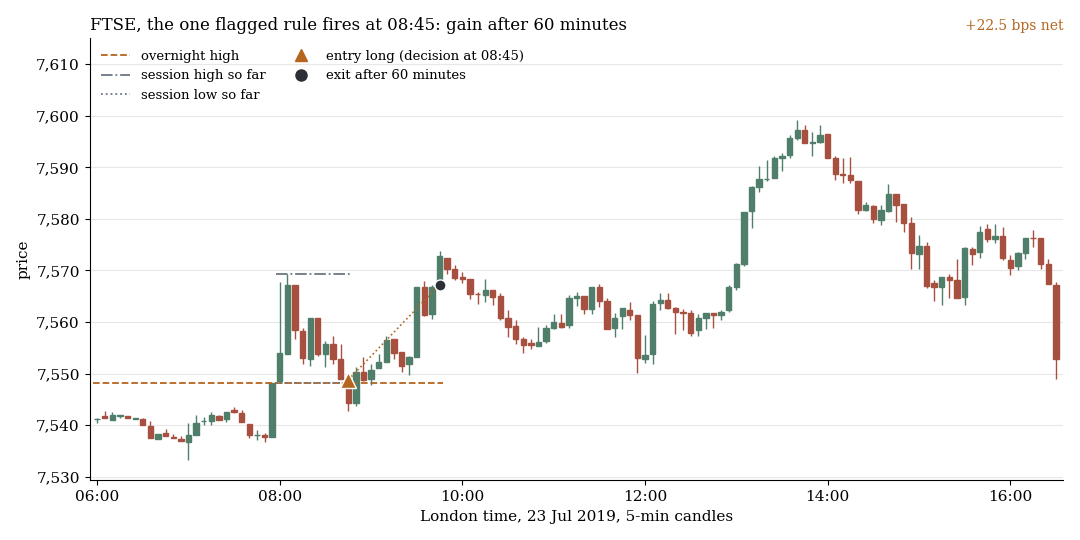
The one rule we flagged from the search as an observation: FTSE, price above the overnight high but in the lower third of the day’s range so far, then long for 60 minutes. 23 July 2019, decision at 08:45, result after costs +22.5 bps.
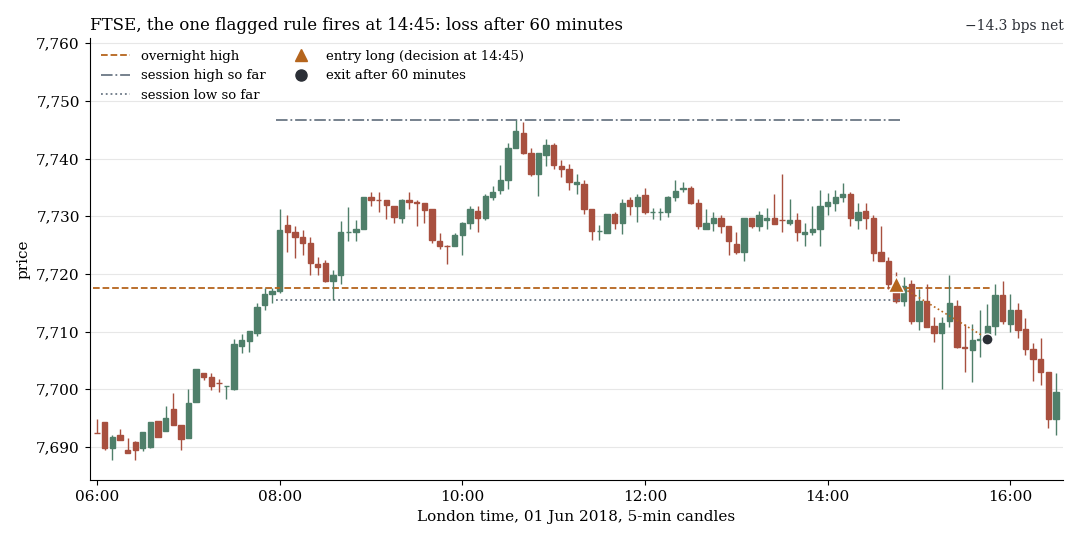
The same rule on 1 June 2018, decision at 14:45, result after costs −14.3 bps. Both examples come from the 2015–2022 search period and were drawn at random from all signals of the rule with a fixed seed, not picked.
1. The best find against the random markets
The random markets keep volatility, volatility clusters and the simultaneity of markets, but every minute candle is randomly mirrored, so no directional structure remains. The same search ran on 20 such markets, about 13.6 million null rules in total. The null includes the real time-of-day drift, so that pure drift rules do not favour the real market. That shows how good the best find of 682,000 rules gets with no pattern at all.
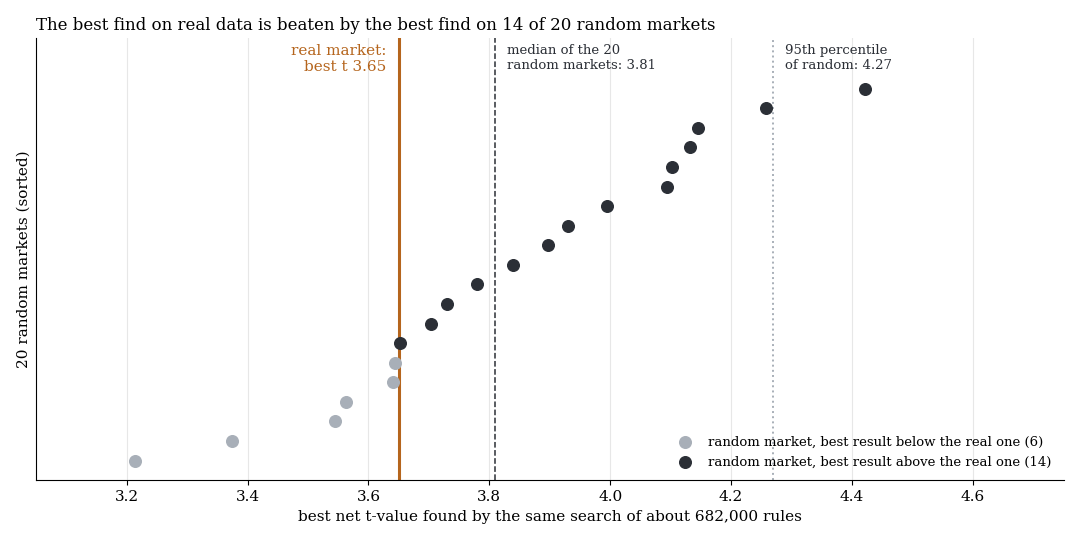
Each dot is a random market and shows the best net t-value the same search finds there. Orange line: best real find (3.65). Dashed: median of the 20 random markets (3.81), dotted: 95th percentile (4.27). 14 of 20 random markets are above the real market.
| Measure | real market | random markets, median or mean | random markets, maximum |
|---|---|---|---|
| best t-value (net) | 3.65 | 3.81 (median) | 4.42 |
| 10th best t-value | 3.10 | 3.19 (mean) | 3.70 |
| best |t| of the excess over the time-of-day drift | 4.55 | 4.65 (median) | 5.09 |
| rules with t ≥ 3 | 12 | 25.5 (mean) | 72 |
| rules with t ≥ 4 | 0 | 0.5 (mean) | 3 |
| top 50 rules confirmed in 2020–2022 | 0 of 50 | 0.55 (mean) | 3 |
Confirmed means net positive and t ≥ 2 in 2020–2022, a period the search did not see. The rank p-value of the reality check is 0.71: the real market cannot be told apart from a market with no pattern. No single market lies above the 95th percentile of its own random version. The multiple-testing correction (BH-FDR, q = 0.10, exact over all 681,882 rules) returns 0 hits.
2. What happens to the best rules
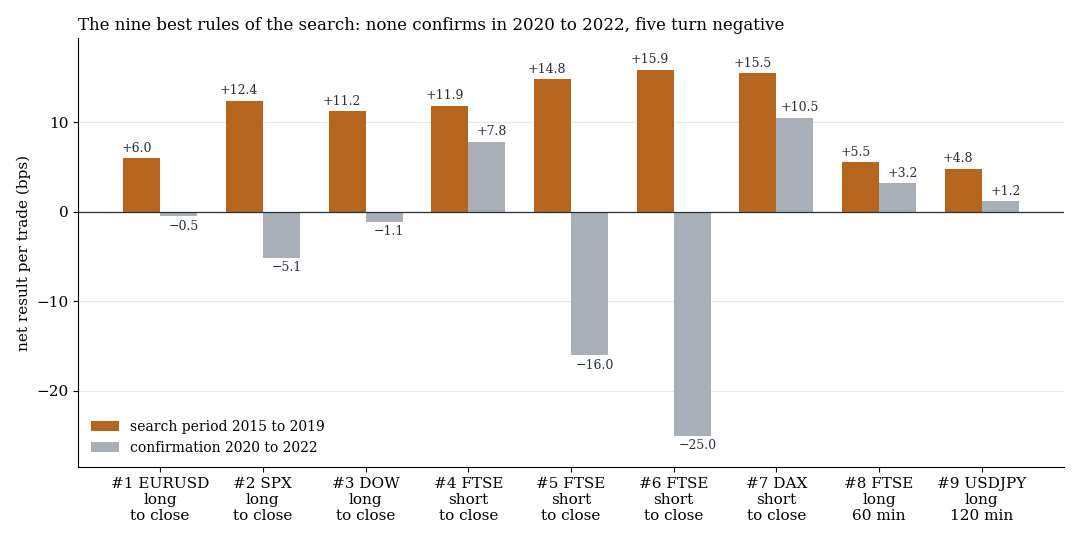
The nine best rules of the search by t-value, net result per trade in the search period (orange) and in the confirmation (grey). Five turn negative, none confirms with t ≥ 2.
The best rule: EURUSD long until the close when the change in the dollar index and the SKEW index (as of before the trading day) were both in the upper third of their history. It earned +5.97 bps net in the search (t 3.65) and −0.52 bps in 2020–2022 (t −0.29). In 2015–2018 it was positive in every year, in 2019 it was at −6.9 bps, afterwards at +0.4, −1.2 and −4.3 bps: a regime artefact.
Of the 500 best rules, 88% exit at the close, because costs then arise only once. In 2020–2022 they earn −1.74 bps net on average, only 38% are positive. That is the typical picture of a selected noise peak: positive in the search by construction, afterwards a coin flip minus costs.
Real structure exists, only tiny: 15-minute fades in EURUSD after a strong rise have an excess over the drift of +0.18 bps (t 3.7), the same in every year. Gross that is 0.20 bps against 1.16 bps of costs, net −0.96 bps (t −19.7), about six times too small.
3. The one rule that was left
Out of 682,000 rules one was left that we flagged as an observation, not a candidate under our protocol: the FTSE rule from the examples above.
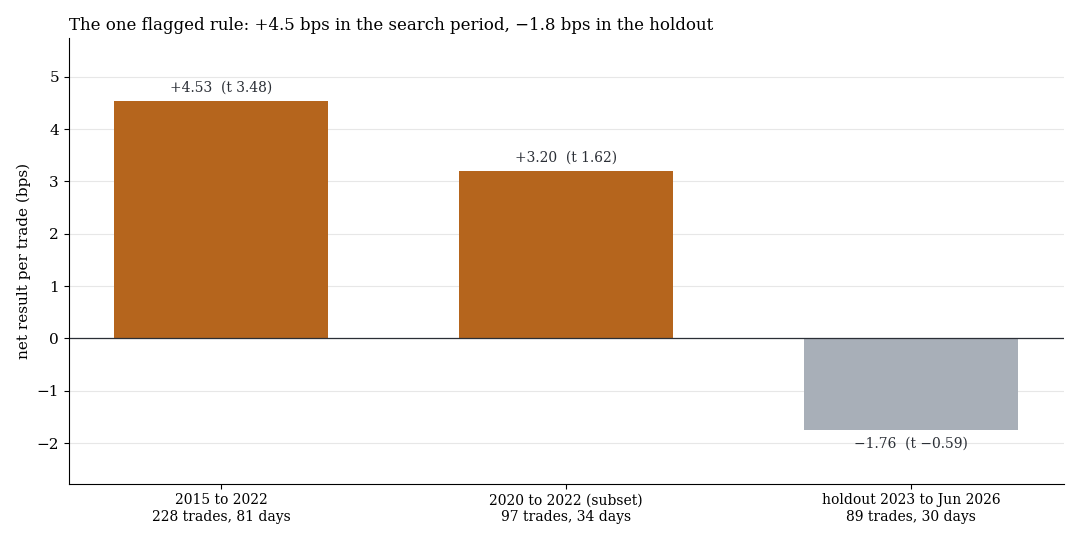
Net result per trade of the flagged rule: search period 2015–2022 (orange), including the 2020–2022 confirmation, and holdout 2023 to June 2026 (grey, one run).
In the search period: 228 trades on 81 days, gross 6.65 bps, net +4.53 bps (t 3.48), seven of eight years positive, random market +1.3 bps (t 0.38). It hung on few days (without the 5 best, t 2.5) and on an outlier year (2019: +21.4 bps). Its search t of 3.11 was below the median of the random maximum (3.81), the 2020–2022 confirmation was at t 1.62.
In the holdout, one run: 89 trades on 30 days, −1.76 bps net (t −0.59), gross +0.09 bps. Against “simply long at the same time of day” the condition adds nothing (excess t −0.05). The holdout has only 30 signal days and cannot rule out a small effect, but it shows none.
What it means
A t-value of 3.65 sounds like a finding. In a search over 682,000 rules it is the normal case: a market with no pattern at all delivers a median of 3.81. The best find says nothing unless you know how good the best find gets without a pattern. A backtest without that comparison cannot separate find from noise. Whoever searches until something turns up always finds something, and the best rules afterwards confirm as rarely as random rules.
That does not mean there are no real effects. There are, but they are smaller than the costs.
Limits
- CFD minute data (BID), fixed cost model. Round trip 1.2 to 3.4 bps, real costs are likely higher. Tick volume (the VWAP block) is not exchange turnover.
- Simple grammar. One or two conditions (tercile or quintile), fixed exits, no stops or targets, no threshold optimisation. Sequences, interactions (see the ML study) and brackets are not covered.
- Random markets. They destroy every directional structure except the time-of-day drift, do not preserve crash skew, and the daily-data blocks (VIX, dollar index) stay real. That changes nothing about the result: the real market lies below the null, not just above it.
- Correlated rules. The number of independent tests is far smaller than 682,000. That is why we calibrate against the maximum of the random markets instead of using a correction alone.
- One holdout for one rule. 30 signal days are not robust. There were no candidates.
All pattern families of the scan in the overview. Related: the random walk as a yardstick, mistakes in AI trading strategies, validation gate study.
Disclaimer: Historical statistics are no guarantee of future market behaviour. This study is not investment advice. Trading carries a risk of loss up to total loss.