Data basis: DAX, FTSE, CAC, Dow, NQ, SPX, gold, EURUSD, GBPUSD and USDJPY; Dukascopy CFD minute data (BID). Search period 2015–2022, holdout 2023 to June 2026 only for the one observation (Crabel's NR7 breakout on gold and FX), one run. Indices in the cash session, gold and FX from 08:00 to 17:00 London time. Entry mostly by stop order with a conservative fill, exit at the latest at the end of the session (intraday). Costs: a fixed round trip of spread plus slippage per market (e.g. DAX 2.5, FTSE 1.5, Dow 4.0, NQ 2.5, SPX 0.8 points), about 2.2 bps on average. Benchmarks: “always in trade direction” (drift), a random market (see the random market as a ruler) and placebo levels at the same distance. No trading recommendation.
Jack Schwager's “Market Wizards” shaped many traders. Behind the interviews stand rules that have long been standard in books and trading software: Linda Raschke's Holy Grail, Turtle Soup, 80-20, Anti and Momentum Pinball, Larry Williams' Volatility Breakout, Oops and Smash Day, Toby Crabel's stretch breakout after the NR7 day, Victor Sperandeo's 2B and 1-2-3, Mark Fisher's ACD and Marty Schwartz's rule to trade only in the direction of the 10-day EMA. The lesson: simple, clearly described rules, traded with discipline, make money.
We rebuilt 16 of these rules as close to the original as we could and tested them intraday. That tests the published entry rules, not the traders. They trade with position sizing, market selection and context, and many originals are trades over two to six days, which we close at the end of the session.
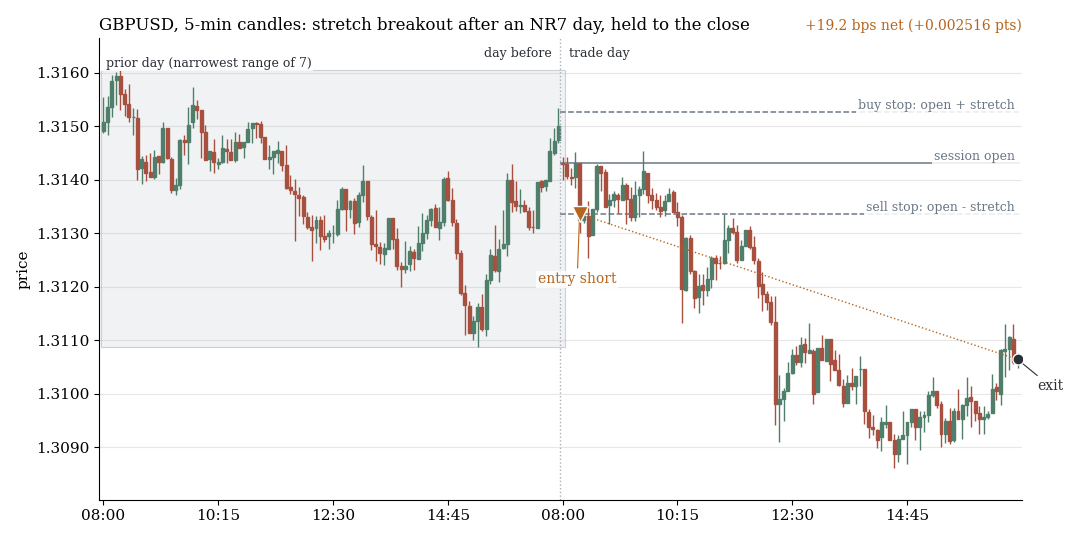
Crabel's stretch breakout in GBPUSD on 8 Nov 2017: the prior day was the narrowest of the last seven (NR7), the sell stop at open minus stretch triggers, and the trade runs to the end of the session (+19.2 bps net).
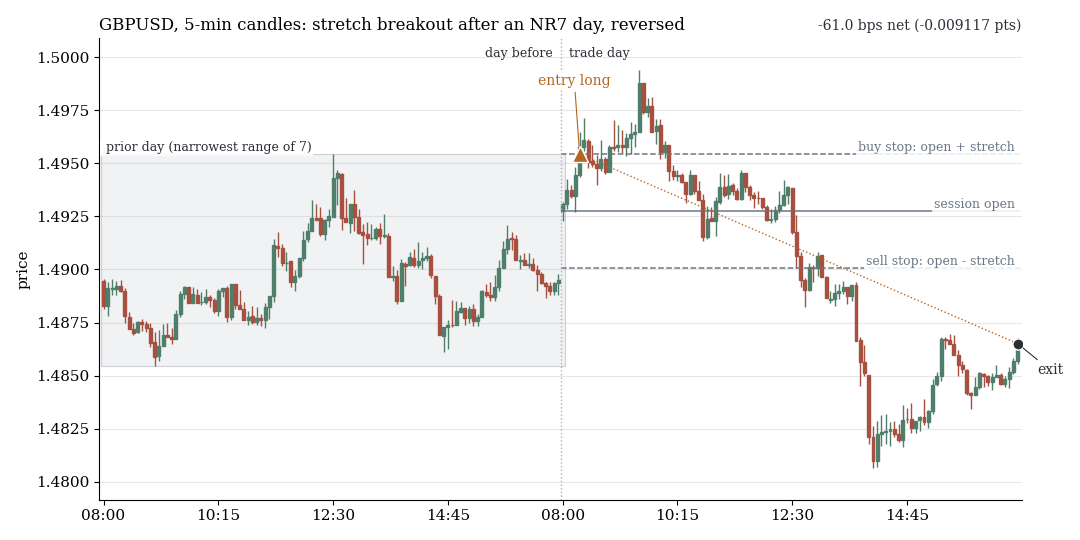
The same sequence on 26 Mar 2015: the buy stop triggers, the price turns and closes far lower (−61.0 bps net). Both examples come from the 2015–2022 search period and were drawn at random, with a fixed seed, from all 1,203 trades of the rule. They were not picked.
1. No test passes the correction, and 54 hits are chance
We tested 16 rules: Raschke 7, Williams 3, Crabel 1 (6 prior-day conditions × 3 time windows), Sperandeo 3, Fisher ACD and Schwartz's EMA10. That makes 2,058 tests on ten markets. The multiple-testing correction (Benjamini-Hochberg, q ≤ 0.10) lets not one pass. The smallest q is 0.19, and the four rows with t > 3 rest on at most 14 trades. At p < 0.05 there are 54 tests, and chance alone expects about 51. Only positive net results are counted; losing rules count as an attempt, not as a hit.
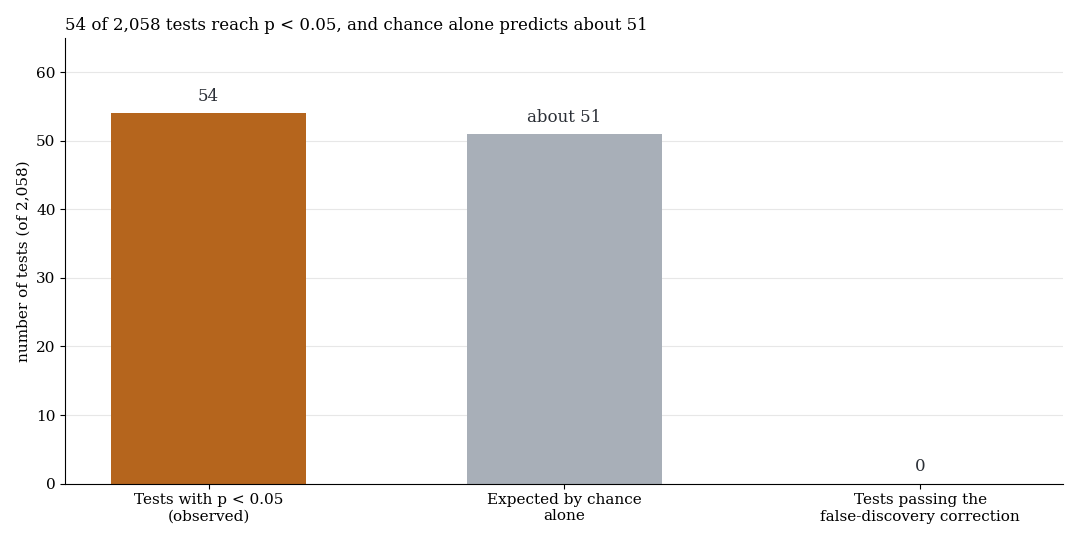
Observed hits at p < 0.05 against the chance expectation. No test passes the multiple-testing correction.
| Rule (all ten markets pooled) | n trades | gross bps | net bps | t (net) |
|---|---|---|---|---|
| Volatility breakout, k 0.5 (Williams) | 14,922 | +1.63 | −0.57 | −0.70 |
| Oops (Williams) | 4,979 | +2.55 | +0.35 | 0.24 |
| Smash Day, naked (Williams) | 3,515 | −2.09 | −4.31 | −2.23 |
| Stretch breakout, all days (Crabel) | 20,007 | +1.10 | −1.09 | −1.50 |
| Stretch breakout after NR7 (Crabel) | 3,031 | +2.48 | +0.28 | 0.18 |
| Holy Grail, 60 min (Raschke) | 604 | +5.36 | +3.18 | 0.95 |
| Turtle Soup, 20 days (Raschke) | 1,027 | +0.28 | −1.91 | −0.74 |
| Turtle Soup +1 (Raschke) | 469 | −5.38 | −7.59 | −1.87 |
| 80-20 (Raschke) | 1,683 | +1.63 | −0.59 | −0.27 |
| Anti (Raschke) | 3,422 | −1.01 | −3.22 | −1.80 |
| Momentum Pinball (Raschke) | 2,923 | −2.23 | −4.39 | −2.46 |
| 2B at the prior-day extreme (Sperandeo) | 12,955 | +2.07 | −0.13 | −0.16 |
| 2B at M15 swings (Sperandeo) | 16,584 | −0.41 | −2.59 | −4.22 |
| 1-2-3, H1 (Sperandeo) | 6,060 | +1.41 | −0.76 | −0.70 |
| ACD A trade (Fisher) | 16,460 | +0.37 | −1.79 | −2.45 |
The rules capture some real movement, but consistently less than the costs: 1–4 bps gross against about 2.2 bps round trip. Holy Grail on daily bars reaches only 91 trades, the 60-minute version is the best rule at +5.36 bps gross, but at t 0.95 it is noise. Conspicuously negative are Raschke's Anti on US indices (−17.3 bps, t −3.21) and Williams' naked Smash Day on EU indices (−11.5 bps, t −2.72). Mirroring these rules would be a direction chosen after the fact, not a hypothesis.
2. Famous levels are no better than arbitrary ones
Prior-day low and 20-day low are said to be places where the market collects stops and turns. We also ran every rule at a random level at the same distance from the open.
| Rule | Rule net bps | Random level net bps | Difference | t |
|---|---|---|---|---|
| Oops (prior-day low or high) | +0.20 | −1.28 | +1.48 | 0.89 |
| Turtle Soup (20-day extreme) | −1.91 | −1.60 | −0.31 | −0.09 |
| 80-20 | −1.08 | −2.37 | +1.30 | 0.54 |
| 2B at the prior-day extreme | −0.69 | −2.05 | +1.36 | 1.57 |
No difference reaches |t| = 2. The famous level alone carries no information.
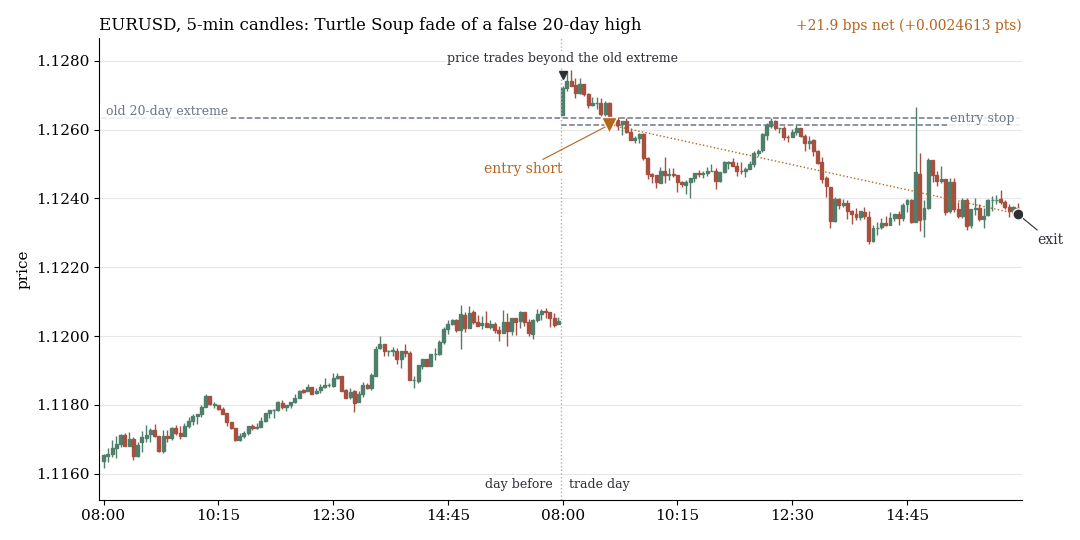
Turtle Soup in EURUSD on 4 Jun 2019: the price trades above the 20-day high and falls back, the sell stop just below it triggers (+21.9 bps net).
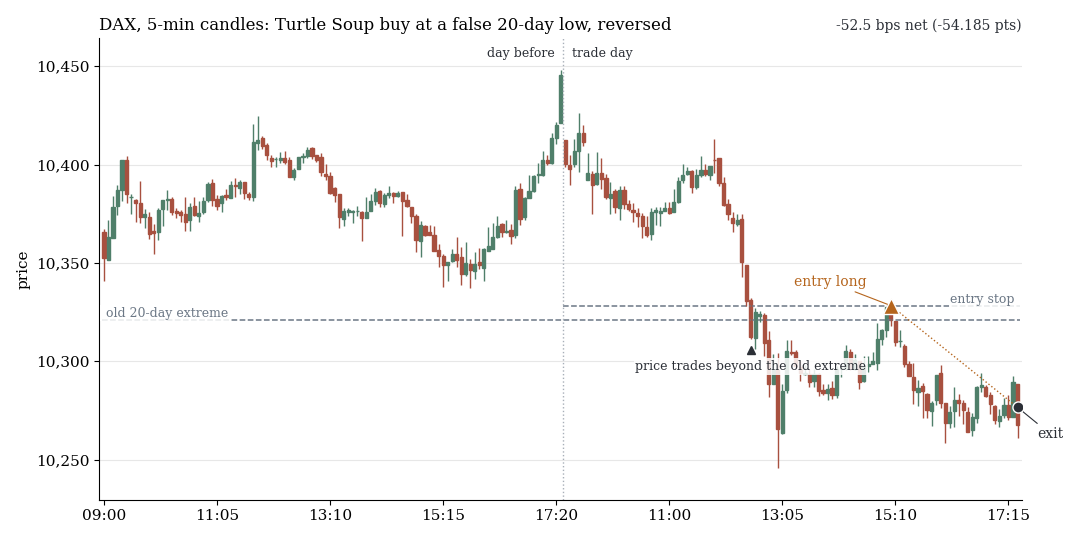
Turtle Soup in the DAX on 16 Sep 2016: the price trades below the 20-day low, the buy stop triggers, and the price falls again afterwards (−52.5 bps net). Both examples were drawn at random with a fixed seed from all 1,027 trades of the search period.
3. Schwartz: the 10-day EMA carries no intraday direction
Marty Schwartz's rule: above the 10-day EMA only long, below it only short. Traded as a plain daily direction (open to session end), it gives −2.83 bps net across all ten markets (t −3.38), −0.63 bps gross, positive in 0 of 8 years. On US indices the next day tends to run against the EMA side. As a filter over 18 base variants, pooled, the trades with the EMA direction sit at −1.65 bps (n 60,705), those against it at −0.96 bps (n 70,729), a difference of −0.69 bps.
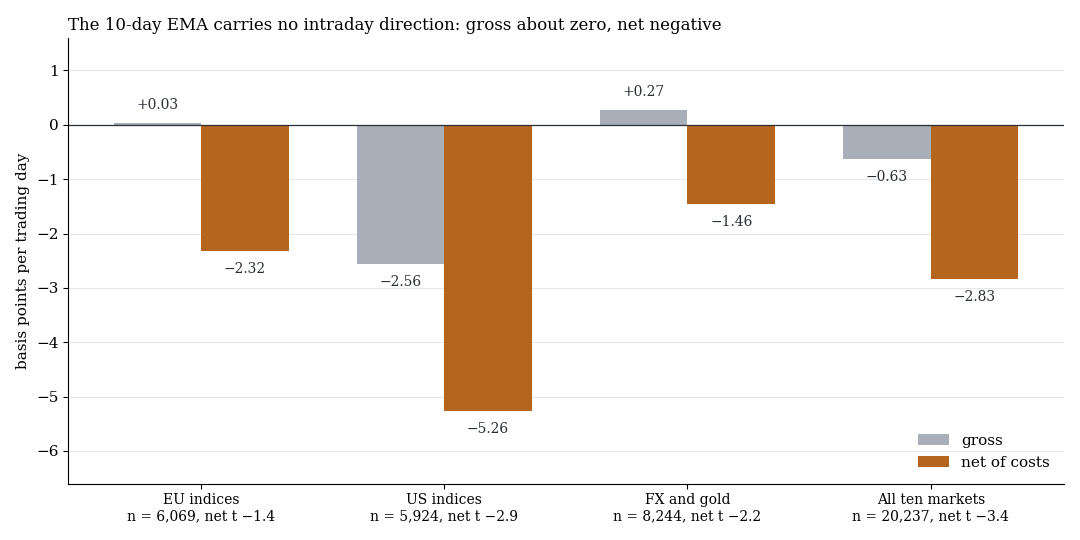
The cash session traded in the direction of close against 10-day EMA: gross (grey) about zero, net of costs (orange) negative in every group.
4. Crabel's NR7 breakout: the one bright spot flips in the holdout
Crabel's idea: after an unusually narrow day (smallest range of the last seven, NR7) the market expands, and a breakout by the typical stretch from the open runs on until the evening. The rule is a stop pair at open ± stretch, exit at 16:59 London time, no stop. Pooled across gold, EURUSD, GBPUSD and USDJPY it looked good: 1,203 trades, +3.49 bps net (t 2.39), positive in 7 of 8 years, 5.20 bps gross against costs of 1.72 bps. All other days sat at −1.14 bps, the random market at zero. On indices the effect did not exist (NR7: EU −1.56 bps, US −2.10 bps).
The weaknesses were already there in the search period: t below 3, a q of 1.0 after correction, and with a session one hour earlier (07:00–16:00 London) only +1.00 bps remain (t 0.65). Part of the effect came from holidays: trades after a holiday NR7 brought +9.58 bps (t 2.56), after normal NR7 days +2.21 bps (t 1.41).
We rebuilt the rule independently and reproduced it exactly. In the holdout 2023 to June 2026, one run, the sign flips: 496 trades, −3.21 bps (t −1.63, one-sided p 0.95), −1.88 bps gross, only 2024 in profit, gold alone −6.65 bps. NR7 days do 3.7 bps worse than the other days, in the search period they were 4.6 bps better.
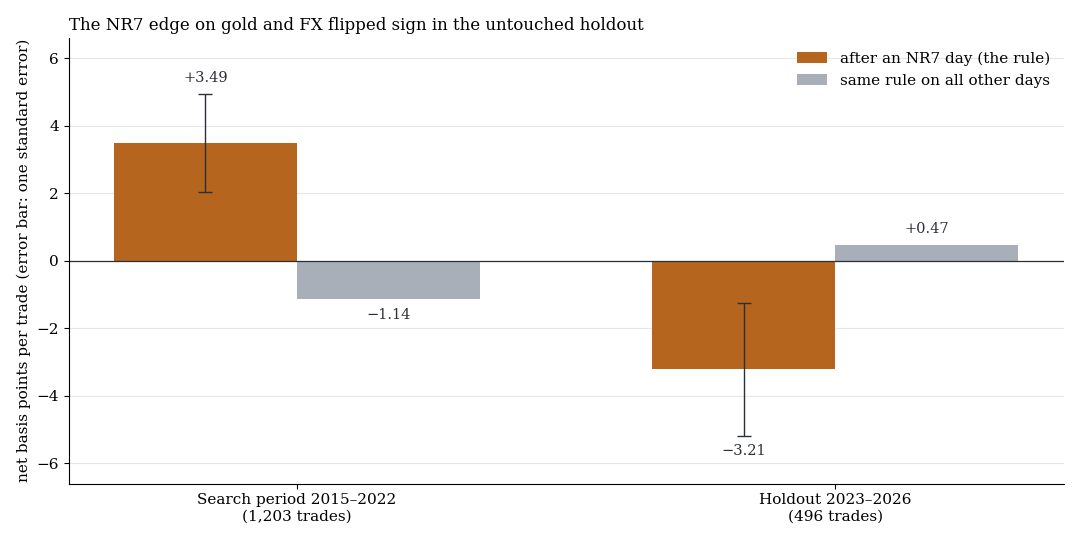
Net bps per trade of the rule after NR7 days (orange, error bar: one standard error) and of the same rule on all other days (grey), in the search period and in the holdout.
What it means
The published entry rules do not carry after costs in 2015–2022, and the one candidate that looked like something was the best hit out of more than 2,000 tries. That fits the literature: McLean and Pontiff (2016) find for 97 published return predictors about 26% lower returns out of sample and about 58% after publication.
What these traders say they do differently is not in the entry rules: position size, loss limits, multi-day holding with trailing stops, market selection, the lower costs of futures and context (Raschke's impulse lead for the Anti, Fisher's “Number Line”). Those parts are cut out here or cannot be formalised as a rule. The selection of survivors also stays invisible: the well-known names are the successful ones out of very many attempts. The only pattern of the scan that passed holdout and global correction is not a chart pattern but a flow with a counterparty (index rebalancing days). A forward test at the Tokyo fix is running as well.
Limits
- Intraday constraint. Many originals are multi-day trades (Turtle Soup, Anti, Pinball). We close at the end of the session, which is no verdict on the multi-day versions.
- The translations are our choices: tick buffers of 0.05 or 0.10 ATR, the FX session from 08:00 to 17:00 London, the reading of “ADX rising”, Anti without the impulse criterion, 1-2-3 without a trendline, ACD without the B level. The single observation reacts sensitively to the session time.
- Small samples: Holy Grail (daily) 91 trades, Holy Grail (60 min) on US indices 69, ACD-C on US indices 97. They are not reliable.
- BID minute data, fixed costs, conservative fills. News spikes and real slippage are missing, reality is more likely worse.
- Not tested: multi-day exits, trailing stops, position sizes, Fisher's Number Line, Raschke's 3-10 oscillator, Williams' %R, discretion.
- Holdout: 3.4 years, one run, power about 55%. The interval [−7.1; +0.7] excludes +3.49.
All pattern families of the scan in the overview. Related: Fisher's day picture as bias, not as trade filter, the ORB paper replicated on five indices and trend days need no catalyst.
Disclaimer: Historical statistics are no guarantee of future market behaviour. This study is not investment advice. Trading carries a risk of loss up to total loss.