Data basis: NQ (Nasdaq CFD), Dow and SPX as controls; Dukascopy CFD minute data (BID), Berlin time axis. Search period 2015–2022 (overnight quotes exist in the feed only from about 2018), holdout 2023 to 5 June 2026 with exactly one run. Costs as a round trip of spread and slippage: NQ 2.5 points in the US cash session, times 2.5 outside it (6.25 points, an assumption), Dow 4 (10 outside), SPX 0.8 (2 outside). Benchmarks: a random market with identical code (every minute candle mirrored at its open with probability ½), placebo of 200 draws of random days, all days without the condition, the opposite direction, random walk (gross 0 R). No trading recommendation.
“If the Nasdaq is down at 8, short the retest.” The idea comes from our own trading and follows a chart saying: after a sell-off, price returns to the broken level, bounces off and keeps falling. The pattern is in every chart book, and live it often feels right.
We fixed the idea so that every part was set before the first run. Condition: NQ at 08:00 Berlin below the prior close. Trade: short at the first retest of a level (08:00 price, prior close, overnight high or VWAP since midnight) after price had been at least 0.2 ATR below it. Stop 0.3 ATR above the level, target 1R or 2R or a time exit. Primary variant: 08:00 price, target 2R, time exit at the US open.
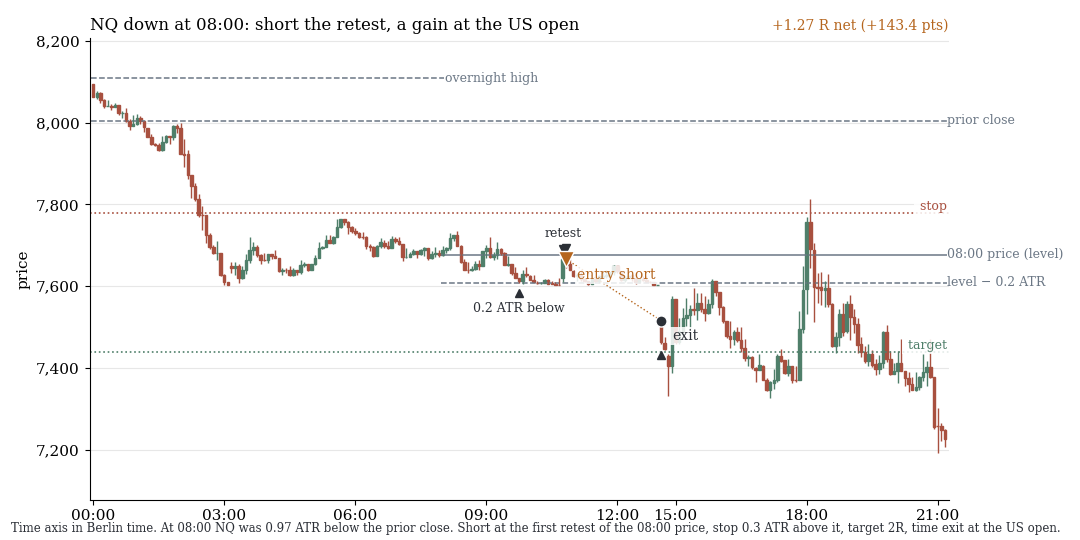
NQ in 5-minute candles, Berlin time. At 08:00 the NQ was 0.97 ATR below the prior close. The rule goes short at the first retest of the 08:00 price, exit at the US open. Result: +1.27 R net.
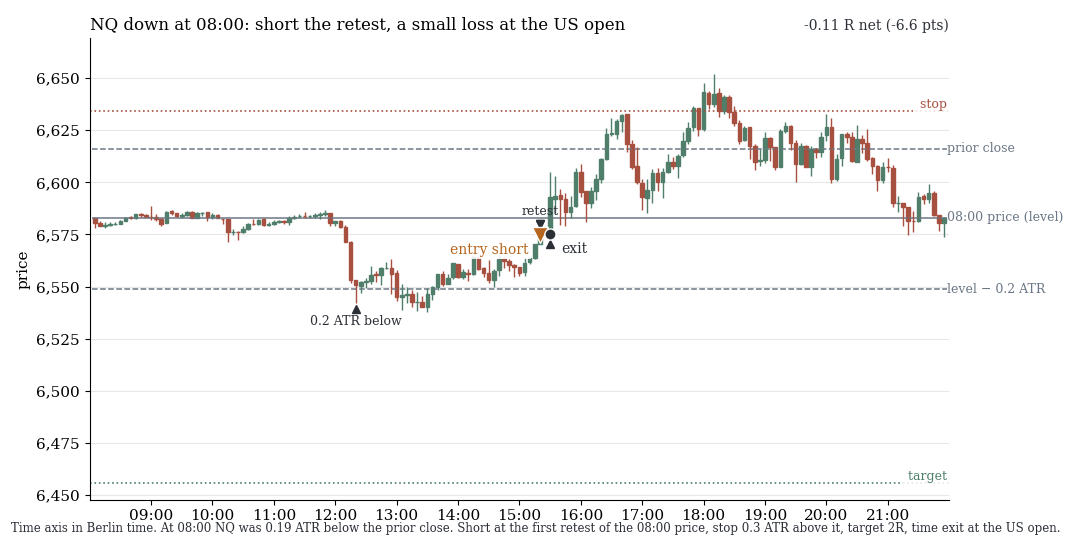
Same rule, a losing case (−0.11 R net). Both cases come from the search period 2015–2022 and were drawn at random from all 177 trades of the primary variant with a fixed seed, not picked.
1. Discovery: not positive in any variant
Primary variant on the NQ, 177 trades per row, retest in the European window:
| Exit | R net | t | hit rate | R gross |
|---|---|---|---|---|
| 2R or US open (primary variant) | −0.263 | −4.95 | 33% | −0.065 |
| 1R or US open | −0.227 | −4.61 | 37% | −0.029 |
| time exit 60 minutes | −0.187 | −4.83 | 29% | +0.011 |
| time exit 120 minutes | −0.196 | −3.27 | 34% | +0.002 |
| US close | −0.317 | −2.80 | 27% | −0.118 |
Median −0.23 R, −0.32 R without the five best days, 1 of 8 years positive (2020, +0.11 R at n 16). Exits: 21% stop, 3% target, 76% time. Costs are 0.20 R per trade. All four levels, target 2R or US open, R net (t):
| Level | NQ | Dow | SPX |
|---|---|---|---|
| 08:00 price | −0.263 (−4.95) | −0.129 (−2.35) | −0.260 (−5.07) |
| prior close | −0.238 (−6.21) | −0.166 (−4.49) | −0.226 (−6.14) |
| overnight high | −0.217 (−4.80) | −0.122 (−2.96) | −0.192 (−4.52) |
| VWAP since midnight | −0.160 (−3.15) | −0.107 (−1.98) | −0.199 (−4.00) |
The US window (retest after 15:30) does not help: NQ −0.140 R (t −2.59), overnight-high variants −0.004 to +0.046 R (t below 1). Stricter conditions change nothing (0.2 ATR below the prior close: −0.249 R, t −2.71; below the Asian open: −0.183 R, t −2.50).
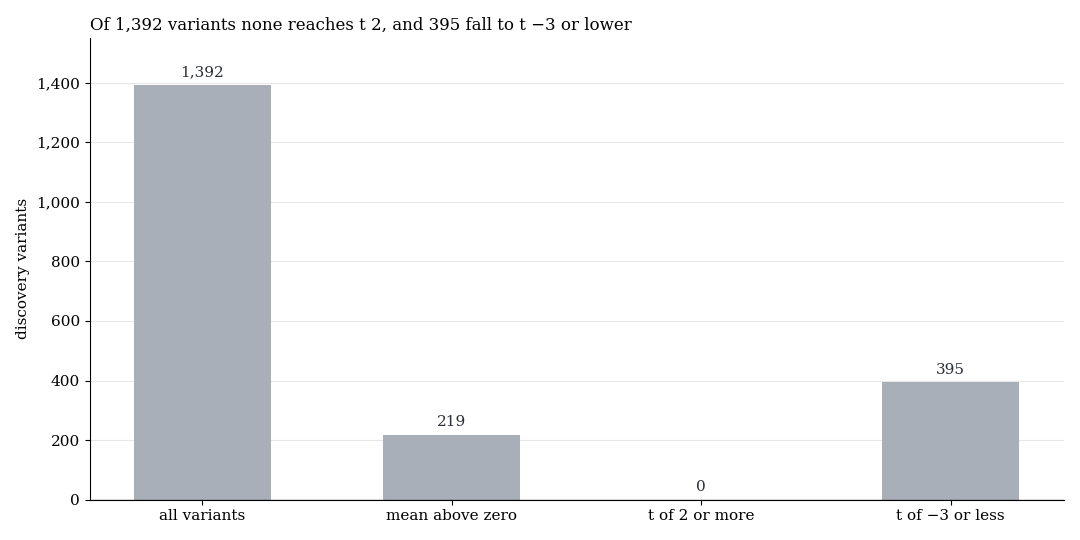
All 1,392 discovery variants by outcome: 219 with a positive mean, none with t of 2 or more, 395 with t of −3 or lower.
The best positive row (Dow, VWAP, US window, below the Asian open, time exit 120 minutes) reaches +0.122 R at t 1.97. NQ and SPX in the same cell sit at −0.05 and +0.01 R. That is noise.
2. Why: a coin flip with costs
| Benchmark (NQ, 08:00 price, European window) | n | R net | t | R gross |
|---|---|---|---|---|
| Rule: down days, short | 177 | −0.263 | −4.95 | −0.065 |
| down days, long instead of short | 177 | −0.239 | −3.49 | +0.025 |
| all days without the condition, short | 399 | −0.213 | −6.36 | −0.017 |
| placebo, 200 draws of random days | −0.215 ± 0.038 | |||
| random market, seed 1 | 218 | −0.276 | −5.8 | −0.010 |
| random market, seed 2 | 204 | −0.181 | −3.3 | +0.049 |
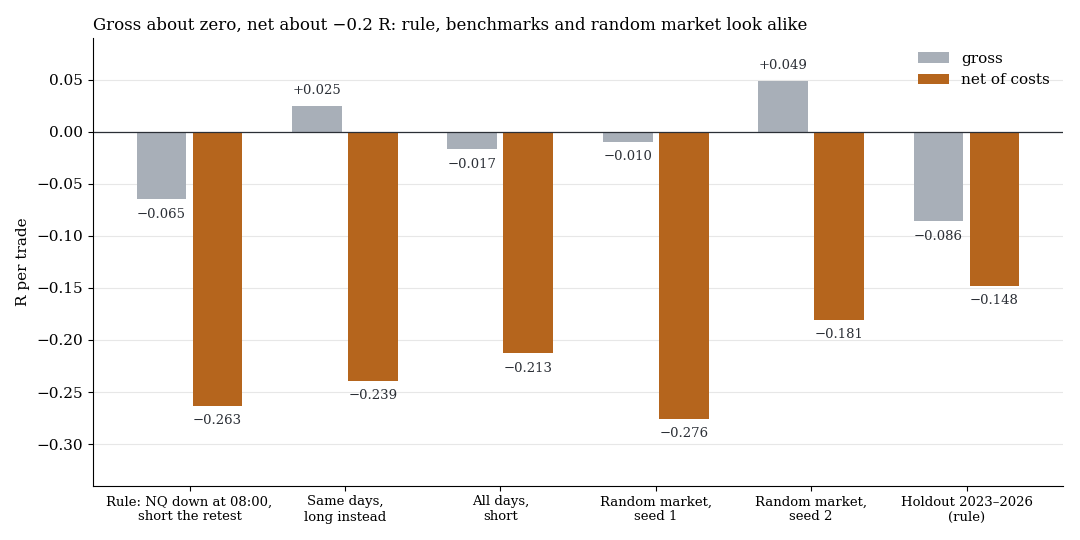
Average R per trade gross (grey) and net (orange) for the rule, its benchmarks and the holdout. Gross everything sits around zero, net around −0.2 R.
Gross, the retest short is a coin flip (−0.065 R, t −1.2). The random market yields zero gross and the same −0.2 to −0.3 R net as the NQ. The loss is the cost load: 6.25 points on roughly 40 to 50 points of risk, 0.20 R per trade at a 33% hit rate. The condition changes nothing: without it the result is −0.213 R, the placebo −0.215 R, and the rule at −0.263 R sits inside the placebo distribution (P(placebo ≥ real) = 0.90). Entry 1 or 2 minutes later and stops of 0.2 to 0.5 ATR change nothing, it is a plateau, but a negative one.
The daily drift does not help either. On down days the NQ rises about 5 points between 08:00 and the US open (gross t about 2.4), against the short but by less than the 6.25 points of cost, and afterwards the drift is zero. The data show mean reversion towards the prior close, not continuation.
3. Holdout: the sign holds
One run, 3 January 2023 to 5 June 2026, primary variant unchanged: n 90, −0.148 R net (SE 0.064, t −2.32, one-sided p 0.99), hit rate 42%, gross −0.086 R (t −1.4). All four years are negative (2023 −0.07, 2024 −0.22, 2025 −0.19, 2026 −0.01 R). 13 trades end at the stop, none at the target, 77 at the time exit. The opposite direction, long, sits at −0.047 R (t −0.5).
What it means
A minus at 8:00 says nothing about the day, and the retest is no entry signal: a coin flip gross, a loss equal to the costs net. As in our first-candle and pre-open-push studies, early moves describe what has already happened. The feeling that the market runs against the trade is not confirmed: the same loss arises on the random market. We do not optimise further, that would be fitting to noise.
Limits
- CFD minute data (BID), fixed cost model. The factor 2.5 outside the US cash session is an assumption. At 2.5 points the primary variant would sit at about −0.14 R (gross −0.065 R minus 0.08 R of cost), still negative. Real fills are likely worse.
- Data gap. The NQ feed has no overnight quotes in 2015 to 2017 and partly 2018 (726 of 2,037 valid days). Overnight-high and VWAP variants exist for 1,269 days only.
- Not tested. Other retest definitions (candle patterns at the level, repeated retests, volume).
- Small samples. The 0.5 ATR condition (27 trades) and US-window cells with n below 100 are not robust. Dow and SPX trade the same days as the NQ, so the pool is no threefold confirmation.
- Discovery against holdout. The holdout has n 90, clearly misses the criterion and confirms the negative sign.
All pattern families of the scan in the overview. Related: Does the first candle set the day?, the pre-open push in DAX and FTSE and late breakouts after an early whipsaw.
Disclaimer: Historical statistics are no guarantee of future market behaviour. This study is not investment advice. Trading carries a risk of loss up to total loss.