Data basis: DAX, CAC, FTSE, Dow, NQ, SPX, JPN225, EURUSD, GBPUSD, USDJPY, gold; Dukascopy CFD minute data (BID). Search period 2015–2022 (660 logged tests), holdout 2023 to 5 Jun 2026 (one run, best find only). Calendar of 3,016 events 2015–2026 (FOMC statement and press conference, NFP, CPI, PPI, ECB, BoE, BoJ, mega-cap earnings), 93% minute-identical with a second source. Entries and exits sit at least 2 minutes away from every event, and reaction trades start at least 5 minutes after the release. Costs: spread plus slippage (indices 0.8 to 11 points, EURUSD 1.3 pips, gold 0.40 USD), indices outside the cash session ×2.5. Benchmarks: comparison days without an event, “always long” on the same days, random markets. No trading recommendation.
Central bank and data releases are the moments when the market moves most. Many rules follow: the market rises before the FOMC (pre-FOMC drift, Lucca and Moench 2015), the reaction to NFP and CPI runs on or reverses, announcement days carry a premium (Savor and Wilson), and then there are the FOMC cycle in weeks and earnings reactions. Such rules are widespread because the moves are large and, in hindsight, every spike can be assigned to a piece of news.
We tested them with comparison days, random markets and a holdout. The result up front: volatility follows the events, direction does not.
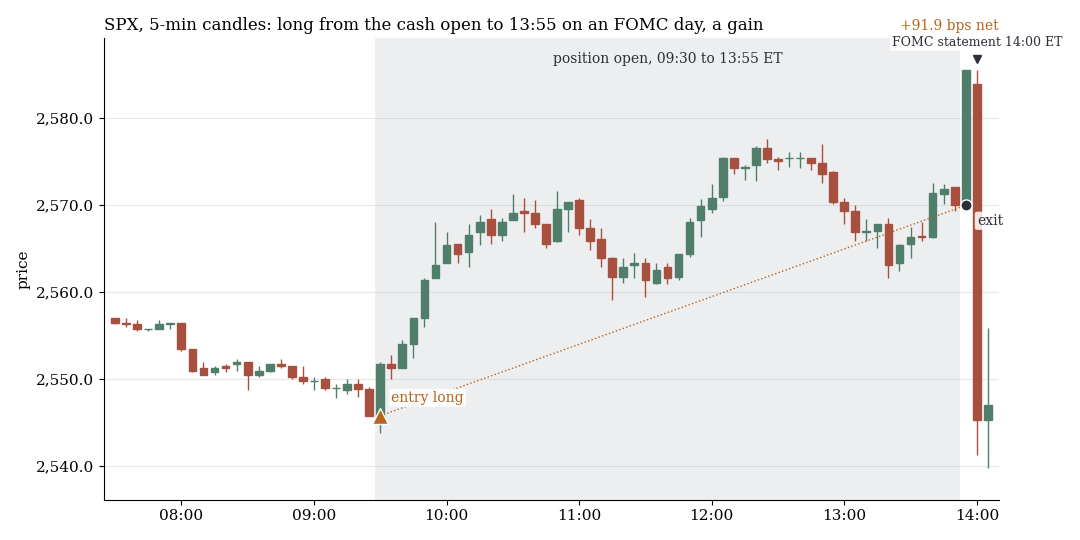
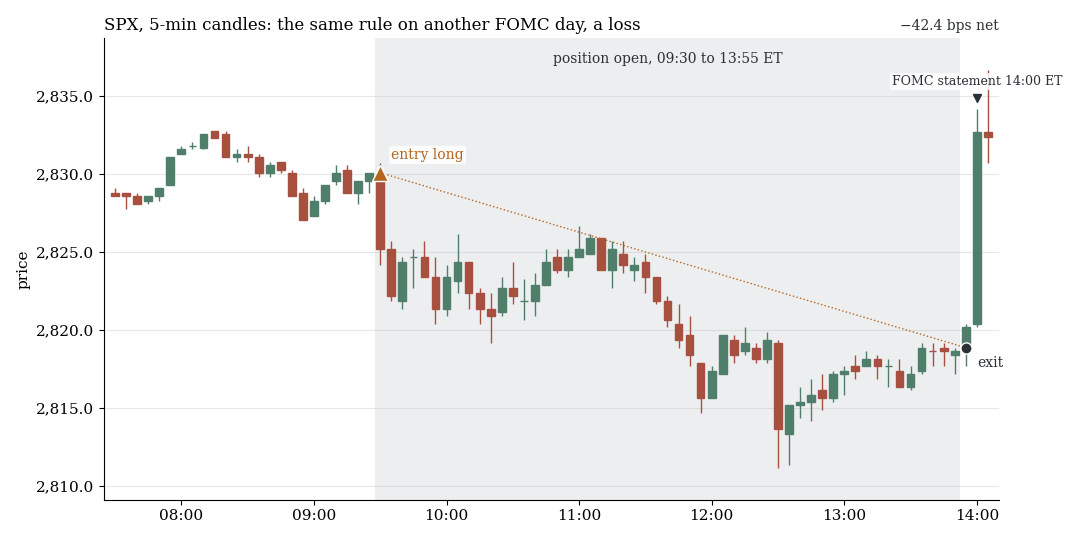
Pre-FOMC drift: on every FOMC day long from the cash open to 13:55 New York, five minutes before the statement. Top: 19 Dec 2018 (+91.9 bps net). Bottom: 20 Mar 2019 (−42.4 bps net).
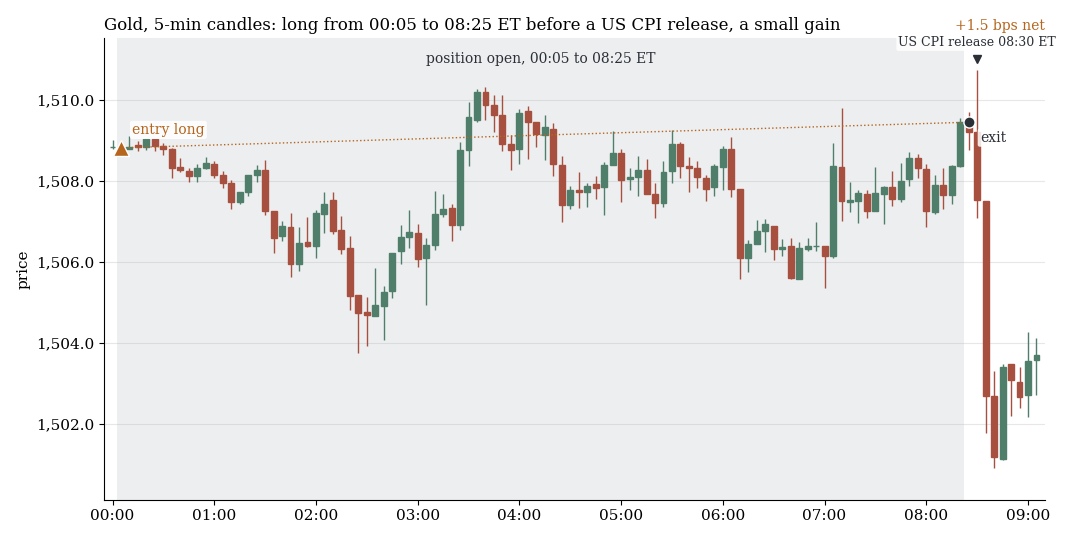
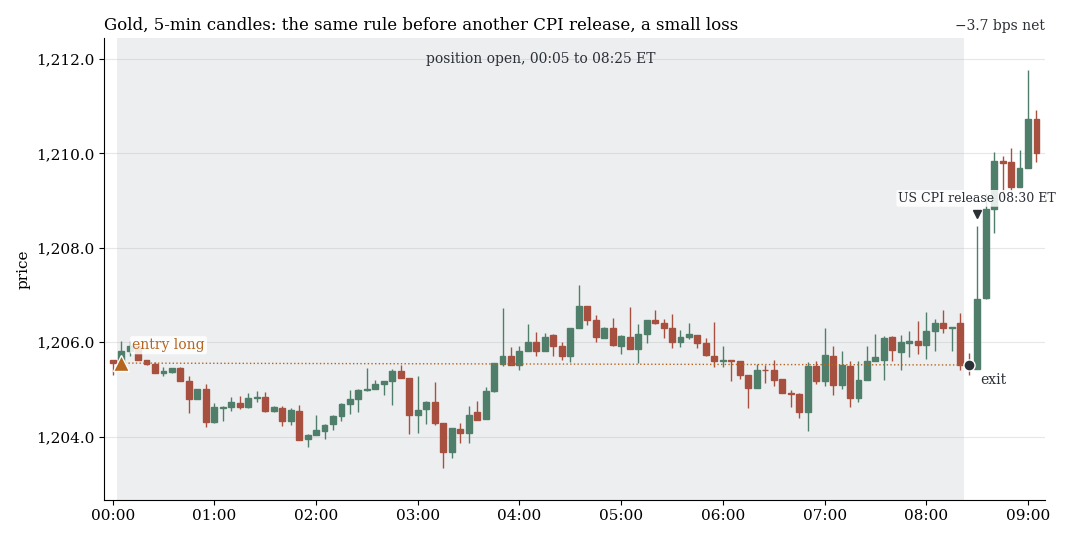
Gold before the US CPI: on every CPI day long from 00:05 to 08:25 New York, five minutes before the release. Top: 10 Oct 2019 (+1.5 bps net). Bottom: 13 Sep 2018 (−3.7 bps net). All four examples are the first winning and the first losing day of a fixed-seed random draw from all cases 2015–2022, not hand-picked.
1. Broad scan: 29 of 580 tests are chance
The test log holds 660 tests, 580 of them from the broad scan (drift before events, reaction after events, event days against normal days, earnings). We choose the direction in the search by the sign of the gross mean. 29 of the 580 tests reach p < 0.05, and pure chance delivers 29. Including the 80 highly correlated variants of two leads, it is 57 against 33 expected: the excess is plateau variants of the same two leads, no new evidence. Of 448 reaction tests, 24 reach |t| ≥ 2, none net t ≥ 3.
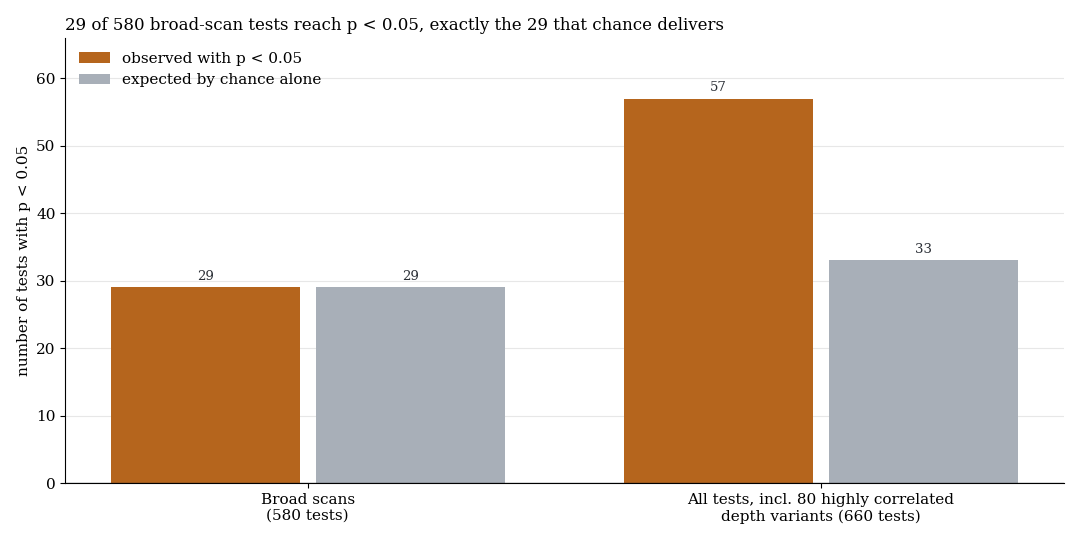
Orange: observed tests with p < 0.05. Grey: expected from pure chance. Search period 2015–2022.
2. Ideas from the literature: nothing intraday
| Idea | Test | n | net | t (net) |
|---|---|---|---|---|
| Pre-FOMC drift | US indices, cash open to 13:55 on FOMC day | 63 days | −2.2 to −0.4 bps | −0.53 to −0.11 |
| Announcement premium | US indices on NFP, CPI, PPI and FOMC days | 337 days | −2.6 bps | −0.52 |
| FOMC cycle | US indices, even weeks | 1,035 days | −2.0 bps | −0.75 |
Gross, the pre-FOMC drift is +0.6 to +2.4 bps (t at most 0.43). Across all six windows and three indices |t| stays at most 1.74 gross, on the day before and after at most 1.55. The reaction to the statement neither continues nor reverses (|t| ≤ 1.3). Mega-cap earnings (197 report days) reach at best net t 1.32.
Events do change how far the market moves. Before the statement the move is only 0.67 to 0.86 times as large as usual, in the hour after it 2.7 to 3.0 times. The pause before the FOMC is real, but directionless.
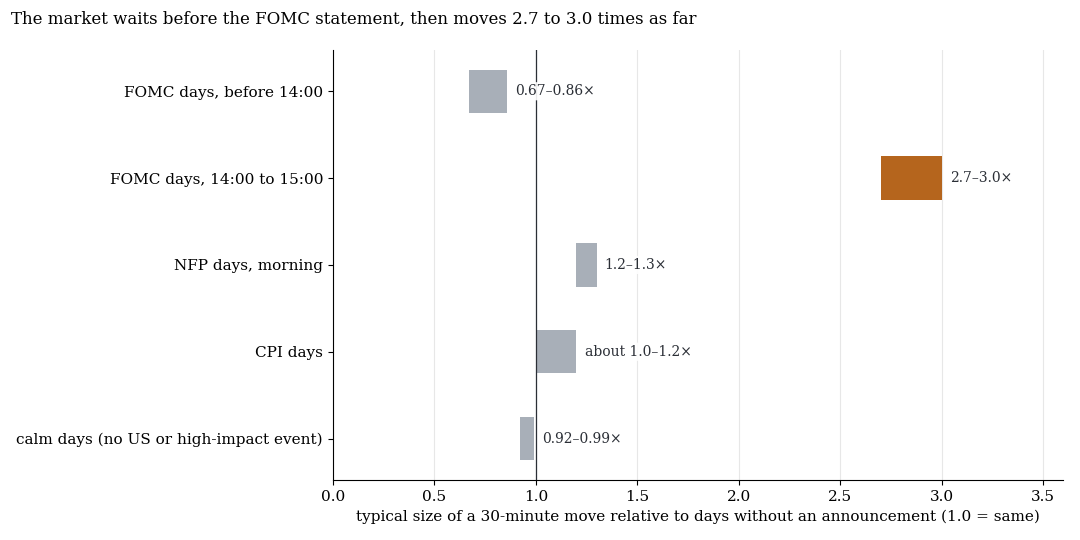
Bars: ranges of the reported factors, 1.0 means as large as on days without an announcement. Search period 2015–2022, descriptive and not part of the test correction.
3. Fading or following the reaction: four leads with t around 2 to 3
| Rule | n | net | t | Afterwards |
|---|---|---|---|---|
| FOMC press conference, EURUSD, fade the 5-minute reaction | 47 | +12.0 bps | 2.90 | USD basket without the five best days t 1.17; at 10 instead of 5 minutes t near 0 |
| NFP, EURUSD, fade the 5-minute reaction | 95 | +6.0 bps | 2.45 | USD basket t 1.02; at 10 minutes t near 0 |
| CPI, DAX, CAC, FTSE, fade a large reaction | 168 trades, 71 days | +15.1 bps | 1.98 | none of 448 variants net t ≥ 3 |
| ECB, DAX, CAC, follow a large reaction | 68 trades, 37 days | +10.6 bps | 2.15 | under 40 days, not reliable |
Both reversal leads hang on the exact signal length of 5 minutes, on few days and, for the press conference, on 2021 and 2022. At the press conference even one random-market run reaches t 3.2. With about 47 event days and fat tails, t values around 3 are not reliable. We rejected both leads.
4. Gold before the US CPI: the best find and its holdout
The best positive test of the 660 was gold long from 00:05 to 08:25 New York on CPI days. In the search: n 94, net +15.7 bps (t 3.2), positive in 6 of 8 years, random market +0.4 bps, q 0.18 after correction. A mechanism was missing: PPI days in the same window sit at −10.4 bps, and retail sales, PCE and GDP are also negative. The effect hung on 2015 (+41.5 bps) and 2020 (+40.7 bps). One single day makes up a sixth of the net sum, and without the five best days 8.4 bps remain (t 2.3).
| Metric | Search 2015–2022 | Holdout 2023–2026 |
|---|---|---|
| CPI nights | 94 | 40 |
| net | +15.7 bps (t 3.20) | −5.7 bps (t −1.10) |
| gross | +18.5 bps (t 3.78) | −4.2 bps (t −0.79) |
| Hit rate | 63.8% | 47.5% |
| Comparison nights without CPI | −2.1 bps | +0.55 bps |
| CPI minus comparison nights | +17.8 bps (t 3.50) | −6.3 bps (t −1.08) |
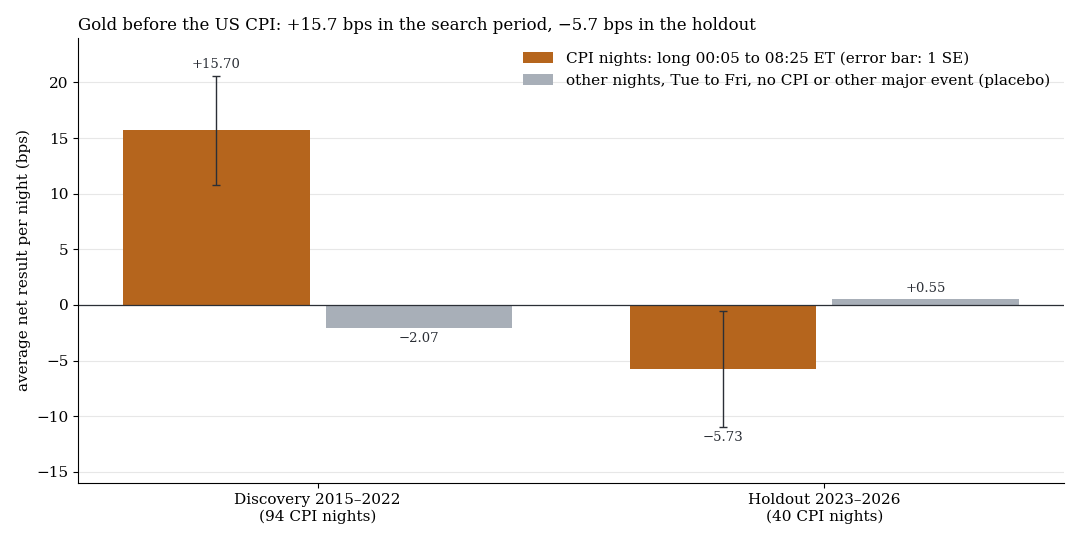
Orange: CPI nights with one standard error. Grey: comparison nights from Tuesday to Friday without a CPI release or another major event.
In the holdout the CPI night is not better than a normal night but 6.3 bps worse. That is not a cost artefact (gross −4.2 bps) and does not hang on one day: without the largest losing day the mean stays at −2.3 bps. The upper 95% bound of the holdout effect is +2.9 bps, at most 18% of the search value. Rejected.
What it means
Events move the market, but not in a direction that survives costs. The market waits before the FOMC statement and then travels almost three times as far as usual, yet neither positioning before it nor following or fading the move after it is a rule. News reactions look like patterns in hindsight because the moves are large and the samples small: 47 press conferences, 94 CPI releases. In practice events work as a risk filter, not as a signal, as in Trend days need no catalyst.
Limits
- Small samples: FOMC 63 days, press conference 47 (16 of them before 2019), ECB 64, NFP and CPI about 95 each. With fat tails, t values around 3 are fragile.
- No surprise data in the search period. We tested only the market reaction (“large reaction” means above the running median of earlier reactions). A surprise filter could show patterns that stay invisible here.
- Costs without news spreads. BID minute data have no spread spikes around releases, and real fills are worse. Index trading right after 08:30 New York fails in the model already on the ×2.5 costs.
- Only the best find ran in the holdout (40 CPI nights, power about 0.67 at the full effect). A small remainder of a few bps is not excluded, but not tradeable. Gold was in a record rally in 2023–2026.
- Not tested: bond auctions, Fed speeches, OPEC, oil inventories, China data, single stocks, holding overnight.
All pattern families of the scan in the overview. Related: Trend days need no catalyst, After the EU close.
Disclaimer: Historical statistics are no guarantee of future market behaviour. This study is not investment advice. Trading carries a risk of loss up to total loss.