Data basis: DAX, FTSE, CAC, Dow, NQ, SPX, EURUSD, GBPUSD, USDJPY and gold; Dukascopy CFD minute data (BID), search period 2015–2022, 5- and 15-minute candles. The best sweep candidate additionally ran once on the holdout 2023 to 5 Jun 2026. Costs per round trip: DAX 2.5, FTSE and CAC 1.5, Dow 4.0, NQ 2.5, SPX 0.8 points, gold 0.40 USD, EURUSD 1.3, GBPUSD 2.0, USDJPY 1.6 pips. Benchmarks: mirrored placebo levels, a random market (each minute candle mirrored at its open with probability ½) and the hit rate of a random walk. No trading recommendation.
The common teaching: a breakout counts as confirmed only after the retest. Large players first take the liquidity behind the prior-day high, then price runs the other way. Smart money concepts (SMC) and ICT turned that into a toolkit: order block, fair value gap (FVG), break of structure, entry at a 70.5% retracement, Silver Bullet, Power of Three.
Whether it says anything in advance, we checked mechanically. Every pattern got a definition fixed beforehand and ran against three nulls: mirrored placebo levels, a random market and the random hit rate of a stop and target. The study is part of a scan over 15 markets with about 893,000 logged tests.
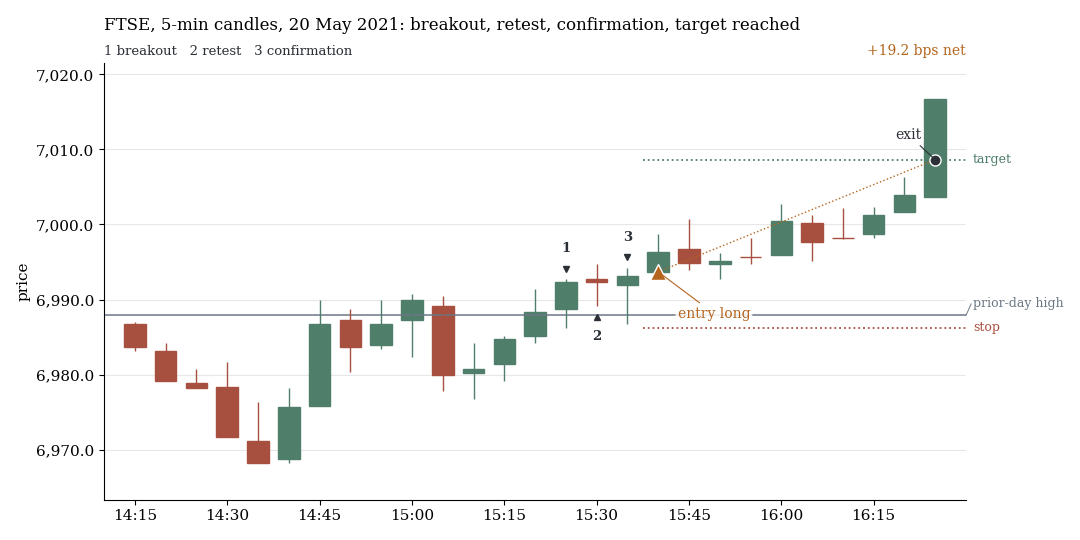
FTSE, 5-minute candles, 20 May 2021: close above the prior-day high (1), return to the level (2), confirmation candle (3), entry long. Target 2 R reached, +19.2 bps net. Drawn at random from all detected cases (fixed seed, not picked), search period 2015–2022.
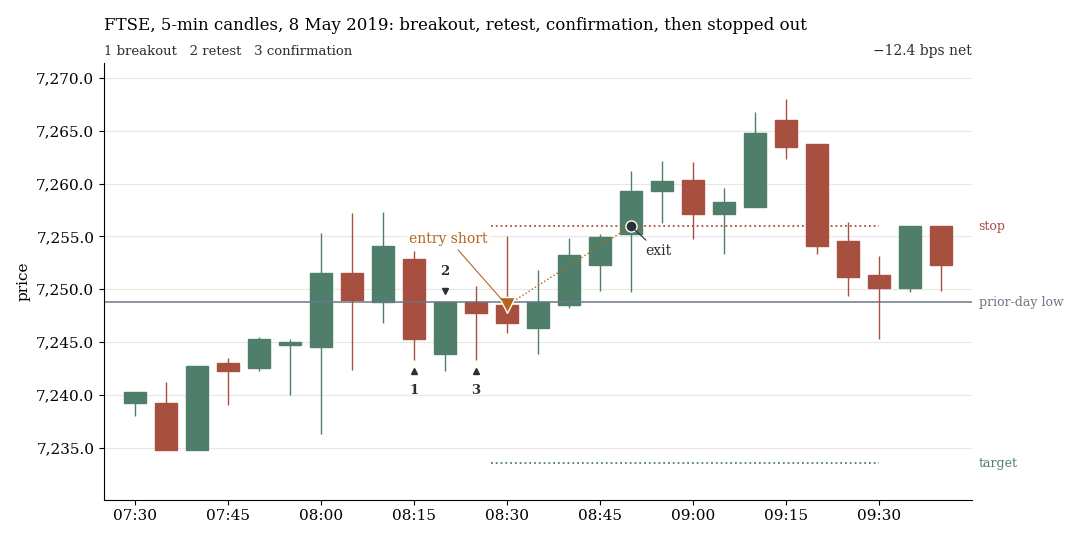
FTSE, 8 May 2019, same rule to the downside: close below the prior-day low (1), pullback from below (2), confirmation (3), entry short. The stop is hit, −12.4 bps net. Also drawn at random.
1. The retest is no better than entering at once
We ran breakout with retest and confirmation in 864 variants: four market groups, six level types each (including prior-day high/low, overnight extremes, opening ranges, Asia range, round numbers, swing points), several configurations and exits. A breakout means a close 0.03 ATR beyond the level, the retest within six candles, the confirmation within three. The alternatives ran on the same breakouts.
| Entry | Rules | best net t | Median gross (bps) | at placebo levels | in the random market |
|---|---|---|---|---|---|
| after retest with confirmation | 864 | 0.41 | −0.17 | −0.04 | +0.07 |
| immediately after the breakout | 288 | −1.10 | +0.01 | +0.04 | −0.02 |
| fade after a failed retest | 288 | 2.02 | +0.48 | +0.31 | +0.05 |
| no retest, price runs away | 96 | 1.20 | +0.27 | +0.40 | −0.19 |
No variant with a retest gets above net t 0.41, and immediate entry does not get above −1.10. Gross sits around zero for both, as in the random market. The frequency is the same too: real levels get a retest with confirmation in 47–57% of breakouts, placebo levels in 47–56%, the random market in 48–55%.
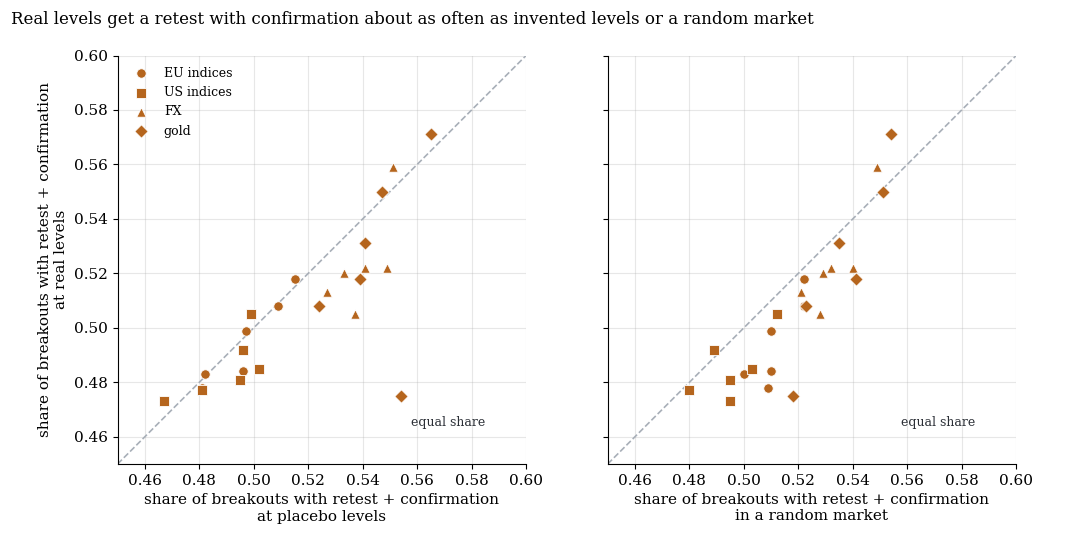
Each point is a combination of market group and level type (24 points, search period). On the diagonal there is no difference. The largest deviation, gold at the prior-day high/low (0.475 against 0.554), goes against the teaching.
No context rescues the breakout. We tested 472 preconditions (compression, equal highs, sweep of the opposite side, killzones, volatility, trend, gap, VIX, news days, earnings days, BOS and CHoCH). No bucket reaches net t ≥ 2, the best is 1.18, only three are positive net.
2. Liquidity sweeps: hit rate like a coin flip
A sweep is a poke through a level with a close back inside within three candles. We measured the fade after it in 841 variants (prior-day high/low, round numbers, equal highs/lows, swing points, Asia range), at a poke depth of 0.05 to 0.3 ATR.
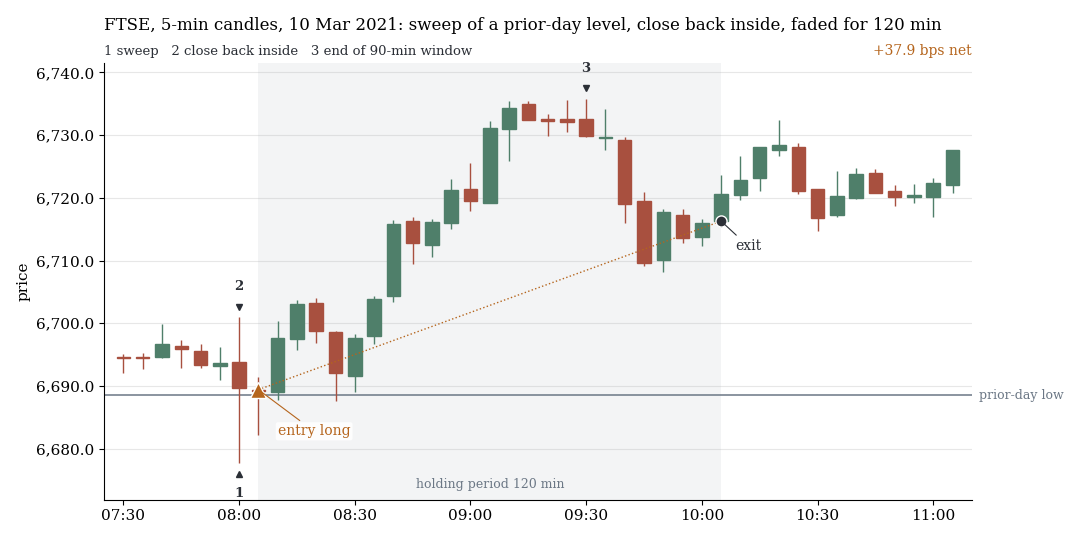
FTSE, 10 Mar 2021: the first candle pokes below the prior-day low (1) and closes above it (2). Fade long, exit after 120 minutes (grey): +37.9 bps net. The 3 ends the 90-minute window. Drawn at random, search period.
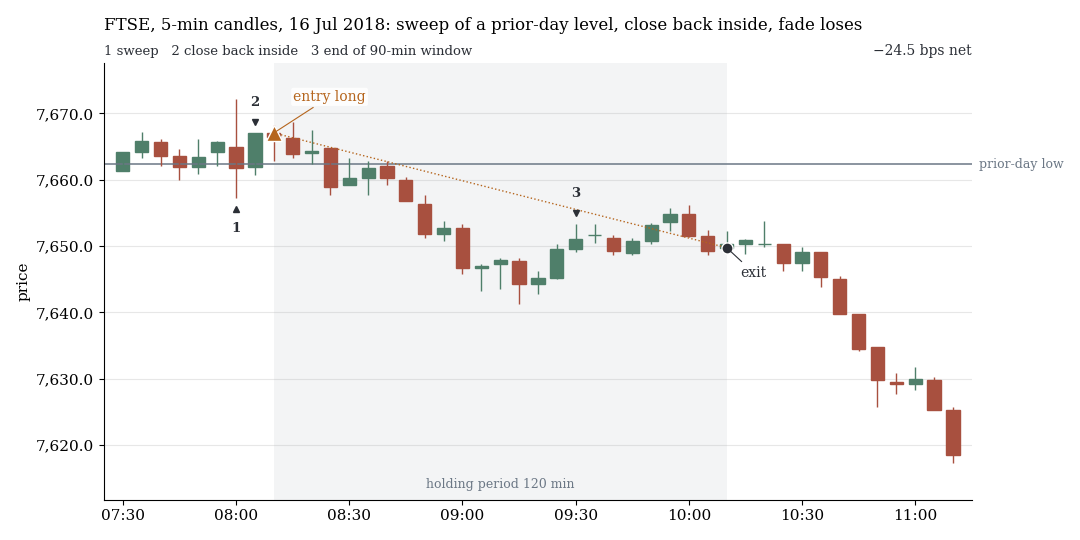
FTSE, 16 Jul 2018, same rule: price keeps falling after the entry, −24.5 bps net.
The hit rates of the fade brackets sit at the chance rate: 0.8 percentage points below at the median, and only 34% of the variants above it.
| Sweep of … | Market | n | Hit rate (1 R, chance: 50%) | net bps (t) |
|---|---|---|---|---|
| equal highs/lows | EU indices | 2,223 | 50% | −2.58 (−5.9) |
| round numbers | EU indices | 1,802 | 50% | −1.73 (−2.2) |
| prior-day high/low, first 90 min | EU indices | 624 | 54% | +0.80 (0.8) |
| prior-day high/low, first 90 min | US indices | 682 | 50% | −2.76 (−2.4) |
| Asia range into the London open | FX | 710 | 54% | −0.47 (−1.4) |
The closest was the sweep of the prior-day high/low in the first 90 minutes of the EU indices, time exit after 120 minutes: n 624, +4.18 bps net, t 2.28, six of eight years positive, −1.96 bps gross at placebo levels. It was weak even then: t 1.57 without the five best days, no single market significant (DAX 0.97), −2.2 bps in the US indices.
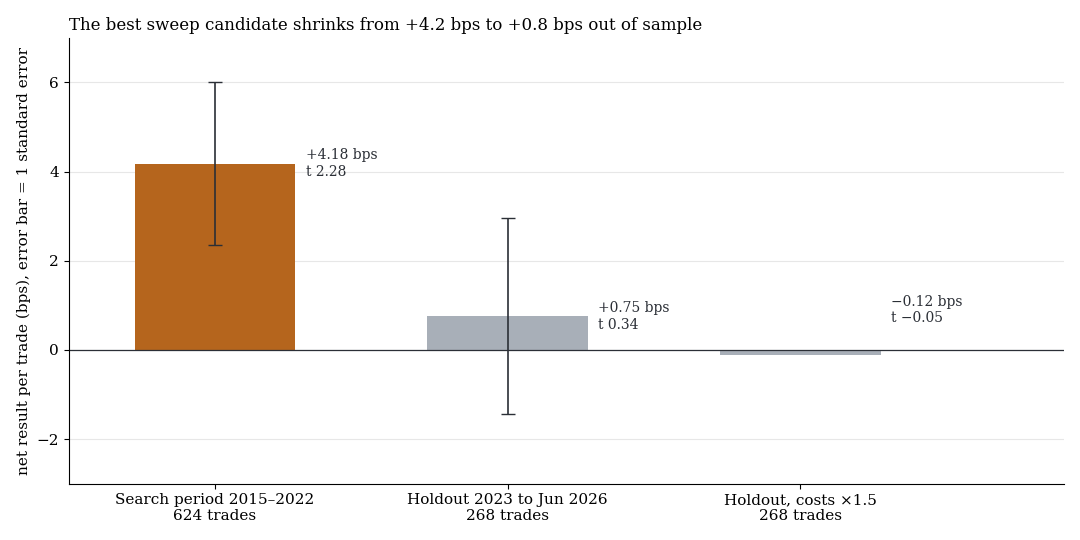
Best sweep candidate: mean result per trade net, error bar one standard error. The holdout ran exactly once.
In the holdout, n 268, +0.75 bps, t 0.34, one-sided p 0.37 remain. In points that is −0.21, at 1.5 times the costs −0.12 bps. The long side earns +6.69 bps, the short side loses −4.52 bps. Buying in the same windows without any signal made +5.44 bps.
3. Order block, FVG, OTE, Silver Bullet, Power of Three
For the ICT building blocks we fixed one mechanical reading each. Structure break: close 0.03 ATR beyond the last swing. Order block: last opposing candle before the break, limit at the near edge, target 2 R. FVG: gap of at least 0.02 ATR between candle 1 and 3. OTE: limit at a retracement of the break impulse. Silver Bullet: first FVG in the windows 03–04, 10–11, 14–15 New York time.
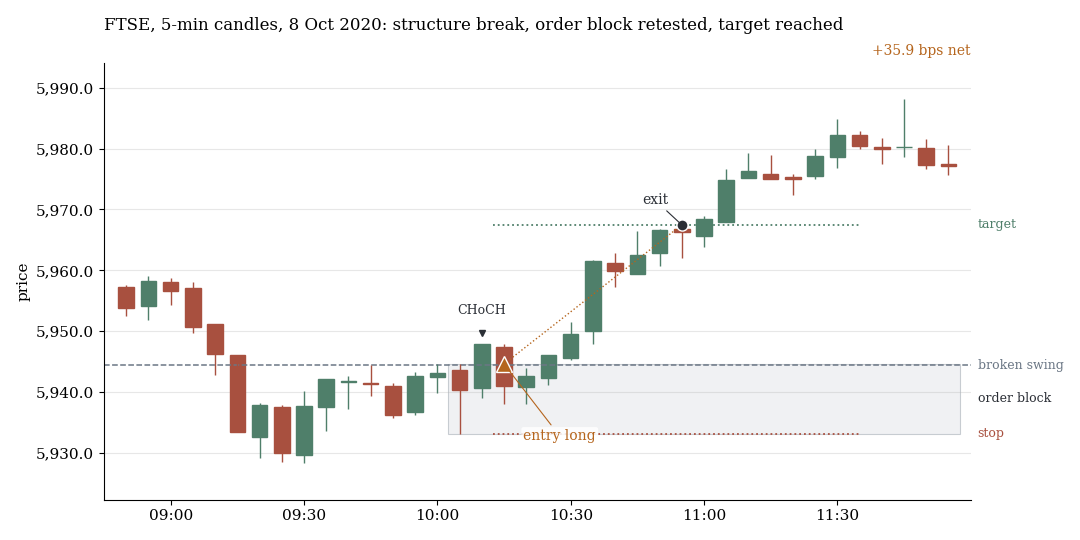
FTSE, 8 Oct 2020: after the structure break (CHoCH) the last opposing candle before it marks the order block (grey box). Limit entry long at the near edge, target 2 R reached, +35.9 bps net. Drawn at random, search period.
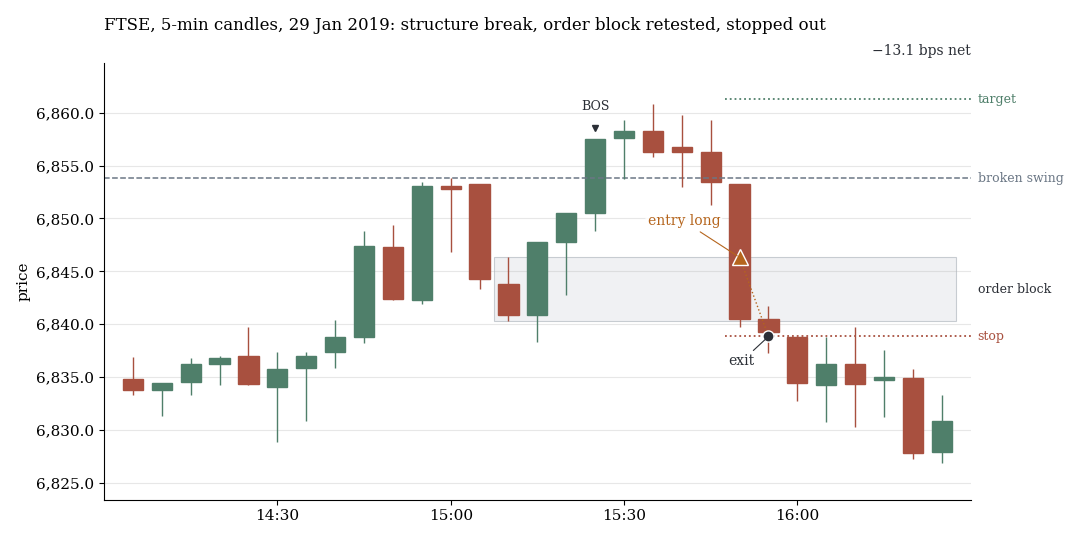
FTSE, 29 Jan 2019, structure break (BOS) and order block: price falls through the far edge, the stop is hit, −13.1 bps net.
| Concept | Rules | best net t | Median gross (bps) | in the random market | Median net (bps) |
|---|---|---|---|---|---|
| Fair value gap | 72 | 0.08 | +0.15 | −0.18 | −2.15 |
| Order block | 72 | −1.96 | −0.14 | −0.16 | −2.69 |
| OTE | 160 | −2.01 | −0.07 | −0.20 | −2.45 |
| Silver Bullet | 114 | −1.51 | −0.05 | −0.20 | −2.27 |
| Power of Three | 12 | −1.65 | −0.33 | −0.15 | −2.51 |
| Judas swing | 12 | −1.73 | −0.59 | +0.17 | −2.44 |
Gross, every concept sits at the level of the random market, net every one is negative. For order block and FVG, all 16 combinations of market, timeframe and concept hit a 1 R target in 48–52% of resolved trades (chance: 50%) and a 2 R target in 27–33% (chance: 33%). The OTE curve is flat: no retracement between 38.2 and 78.6% beats another, the ICT zone of 62–79% included.
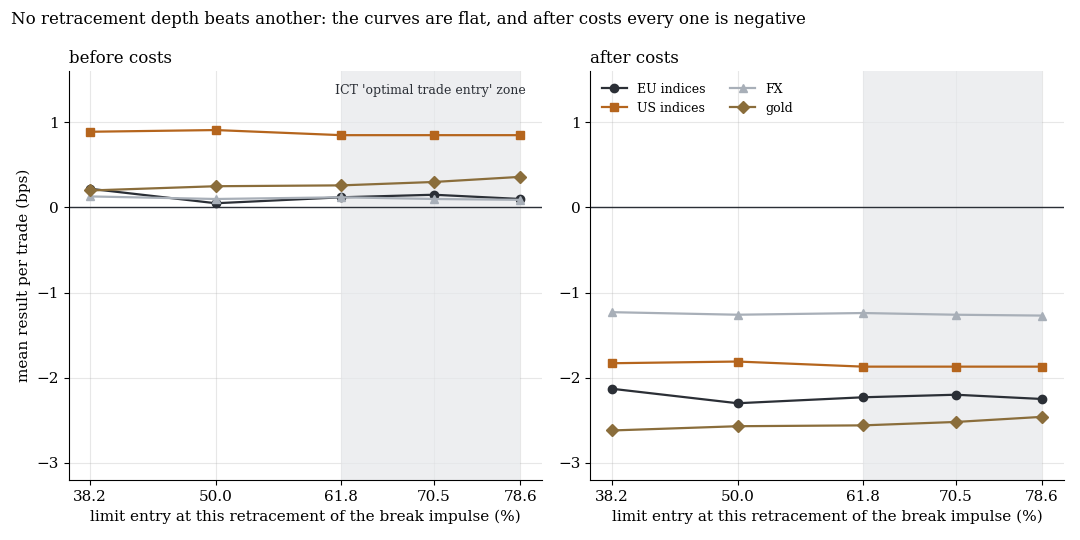
Limit entry at different retracements of the break impulse (5-minute candles, target 2 R). Left before, right after costs. Grey: the ICT zone.
The Silver Bullet windows are placebo hours: in FX the three ICT windows sit at −0.50 to +0.08 bps gross, four placebo hours at −0.32 to +0.23 bps.
FVGs are filled as often in EU and US indices as in the random market (deviation at most 0.9 percentage points). In FX and gold it is +1.3 (t 9.9) and +0.9 percentage points (t 4.1). Only these four descriptive fill-rate tests pass the multiple-testing correction. The FVG entries themselves are negative net.
What it means
The patterns describe what prices do anyway. About half of all breakouts end in a retest with confirmation, at real levels as at invented ones. On a chart you see the cases where the picture worked out; the inconsequential ones are rarely counted.
Two remainders are real and still no trade: the FVG fill rate in FX and gold (1 percentage point) and a slight pullback of breakouts over short-term swings in FX, gold and EU indices (−0.2 to −0.8 bps gross, |t| up to 6.7). The second is the opposite of the teaching but far below the costs. Anyone trading these patterns pays the spread for structures that are smaller than the costs or indistinguishable from chance.
Limits
- CFD minute data (BID). No order flow, no futures, no real volume.
- Fixed cost model. Real costs at the open and on stop orders are probably higher. The null results stay because gross is mostly at zero.
- One mechanical reading per term, plus variations (15-minute candles, thresholds, stricter confirmation, stop-order entry). Not tested: higher timeframes, multi-timeframe confluence, volume, order flow, discretionary judgement of a retest.
- The search period is in-sample. Only the sweep candidate ran on the holdout. With 268 trades and a standard error of 2.2 bps, a real effect of 2 to 3 bps could not be separated from zero there either.
- Many tests. With 3,308 trading rules the correction demands about net t ≥ 4 for a single find.
All pattern families of the scan in the overview. Related: breakouts and the close, the second break, Fibonacci zones against the random walk.
Disclaimer: Historical statistics are no guarantee of future market behaviour. This study is not investment advice. Trading carries a risk of loss up to total loss.