Data basis: DAX, FTSE, Dow, NQ, SPX; Dukascopy CFD minute data (BID), search period 2015–2022 (about 2,000 trading days per market), plus a single holdout 2023 to Jun 2026. Overnight range (ONR) = high and low of all minutes from the cash close to the cash open, only days with at least 550 overnight minutes. Turning point = pivot of a zigzag with a 0.15 ATR counter-move, zone ±0.05 ATR. Benchmarks: placebo levels (shifted by 0.1 to 0.5 ATR), a mirrored level, a random market (each minute candle mirrored at its open with probability ½). Costs: none, because the precondition for a trading test was not met. No trading recommendation.
Anyone who scrolls back through charts sees it: at the high of the night and at the prior close, price often turns. So our question was whether turning points cluster in a small zone around the ONR high, the ONR low and the prior close. We measured it the way you see it on a chart, as a count. And we ran the same count at placebo levels and in a random market.
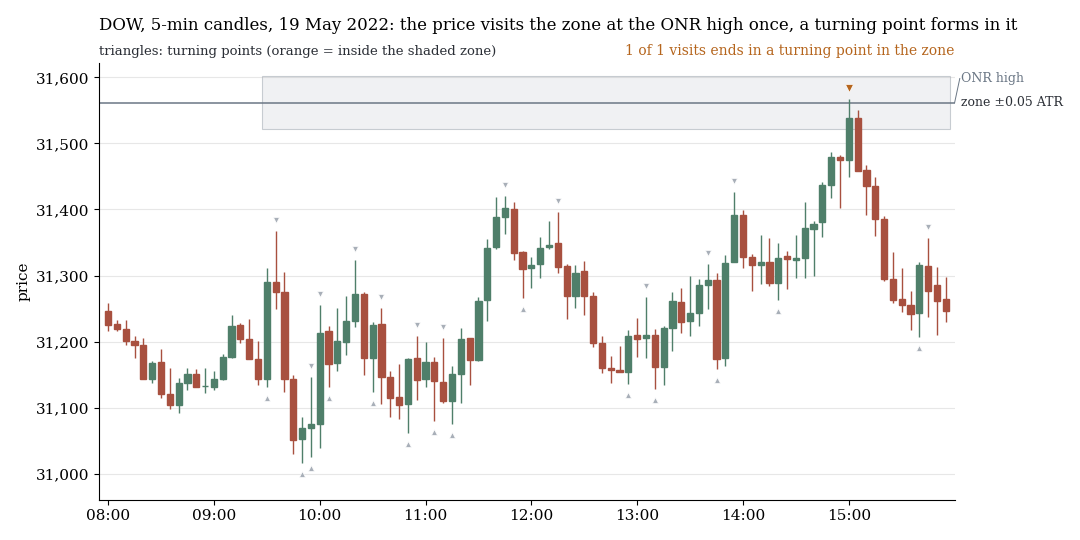
DOW, 5-minute candles, 19 May 2022: price visits the zone around the ONR high (grey box, ±0.05 ATR) once, at 15:00, and turns there (orange). Grey triangles: the other turning points of the day. The example comes from the search period 2015–2022 and was drawn at random from all days with a zone visit (fixed seed, not picked).
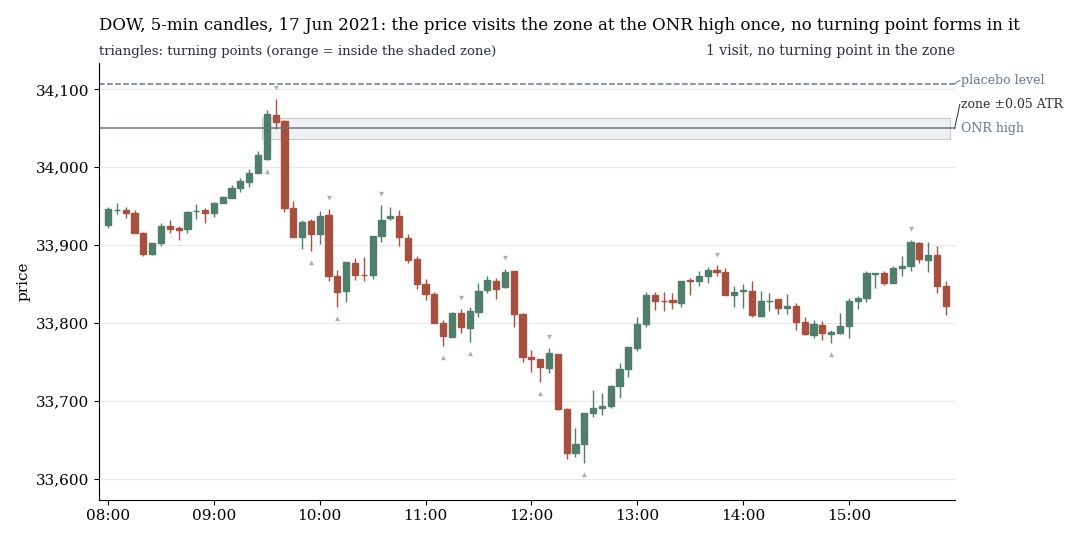
DOW, 17 Jun 2021: price touches the zone right at the start of the session and leaves it without a turning point in the zone. Dashed: the placebo level, 0.1 to 0.5 ATR above. Also drawn at random.
1. Yes, there is a cluster
We counted all turning points of the cash session (about 14.5 per day) and compared the share inside the zone with a placebo level, the same level shifted by 0.1 to 0.5 ATR. At the real level there are 7 to 25% more turning points.
| Level | Market days | Share of turning points in the zone | real / placebo | in the random market, real / placebo |
|---|---|---|---|---|
| ONR high | 6,169 | 5.7% | 1.15 | 1.19 |
| ONR low | 6,169 | 5.9% | 1.07 | 1.20 |
| Prior close | 9,913 | 6.6% | 1.25 | 1.20 |
| Prior-day high | 9,913 | 4.3% | 1.10 | 1.10 |
| Prior-day low | 9,913 | 4.5% | 1.07 | 1.08 |
2. The cluster is an artefact of time spent
A random market whose candle direction is rolled at random shows the same cluster (1.19 to 1.20 at the three levels). The reason is geometry: the placebo level sits 0.1 to 0.5 ATR away, above the ONR high, below the ONR low or further from the open. Price spends less time there, so there are fewer turning points there too. The only deviation from the random market is small: at the prior close 1.25 against 1.20, and at the ONR low the real cluster is even smaller than in the random market.
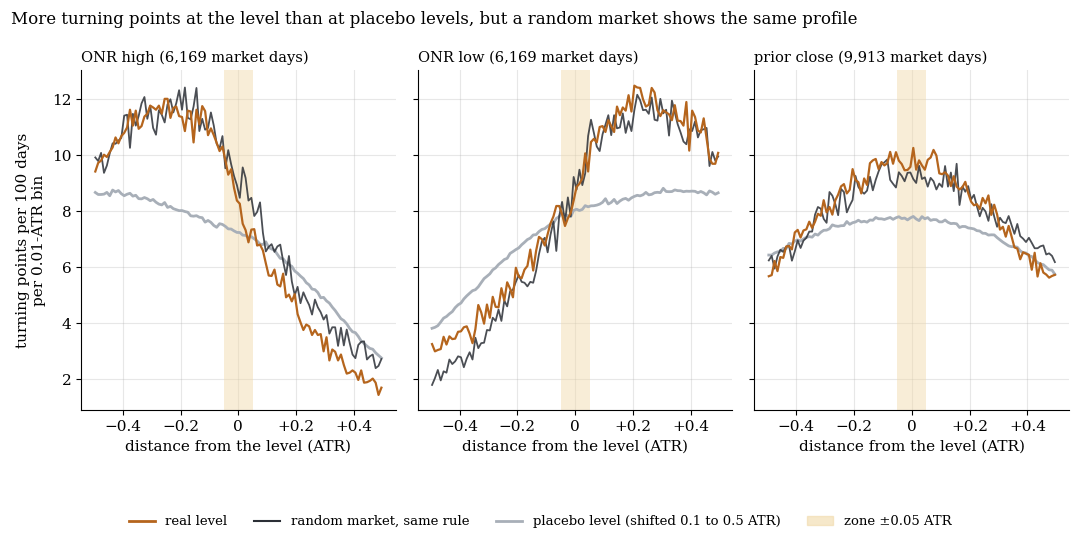
Distance of the turning points from the level, five markets pooled, search period 2015–2022. Orange: real level, grey: placebo level, dark: random market with the same rule, shaded: the zone. Real level and random market lie on top of each other, and nowhere is there a spike in the zone.
3. Per visit, price turns slightly less often at the real level
So we normalised: how often does a visit to the zone end in a turning point inside the zone? A visit starts with the first touch and ends as soon as price has left the twice as wide zone (±0.10 ATR) completely.
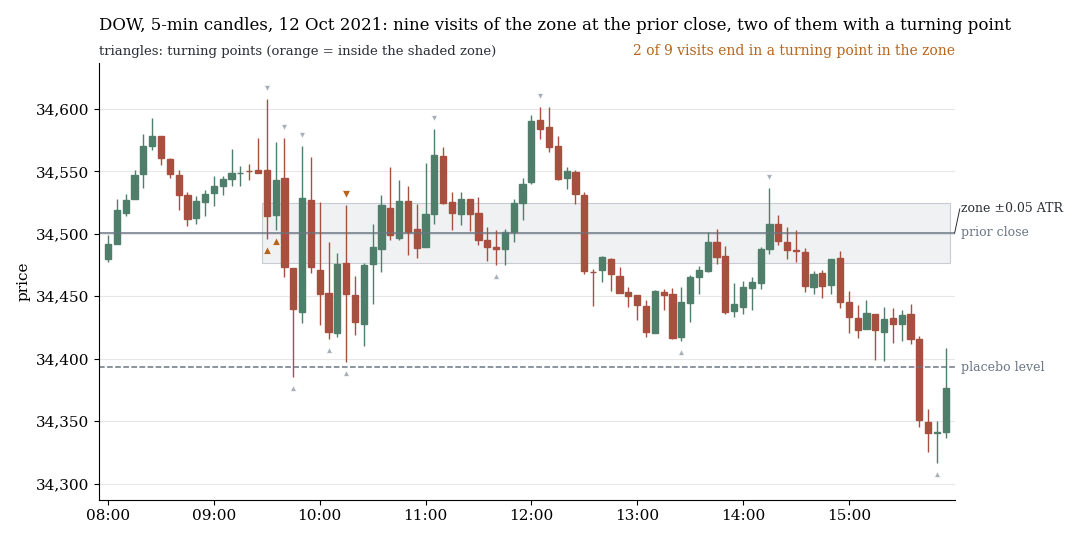
DOW, 12 Oct 2021, zone around the prior close: nine visits, two of them end in a turning point inside the zone (orange). Drawn at random, search period.
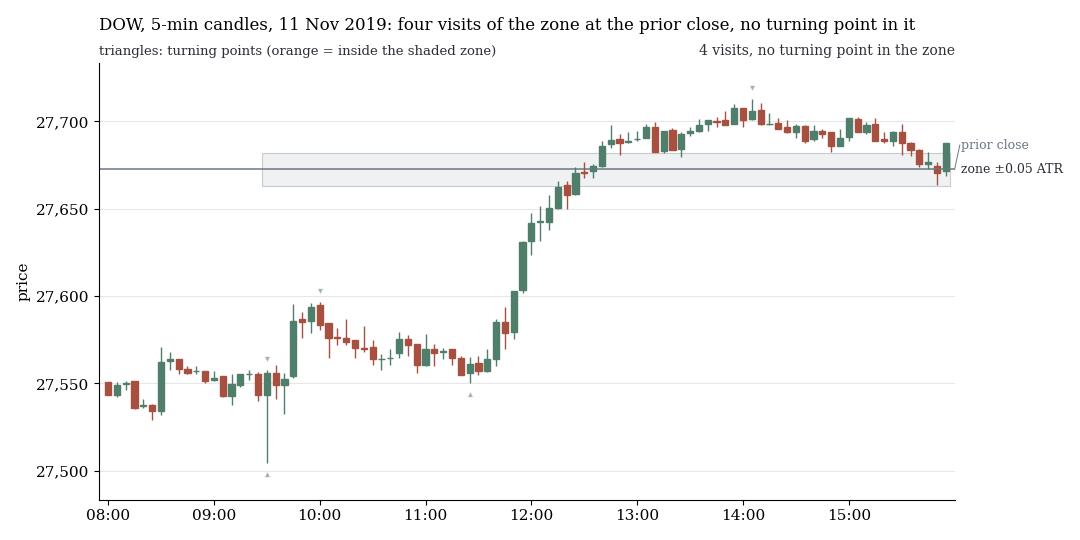
DOW, 11 Nov 2019, zone around the prior close: four visits, no turning point in the zone.
| Level | Period | Visits | real | placebo | random market | t (real − placebo) |
|---|---|---|---|---|---|---|
| ONR high | search | 13,613 | 36.8% | 38.5% | 39.4% | −3.5 |
| ONR high | holdout | 10,580 | 37.2% | 39.3% | 39.4% | −4.0 |
| ONR low | search | 13,220 | 39.0% | 40.4% | 39.1% | −2.9 |
| ONR low | holdout | 9,576 | 40.3% | 40.3% | 39.3% | −0.1 |
| Prior close | search | 24,477 | 38.2% | 39.6% | 39.2% | −3.9 |
| Prior close | holdout | 10,770 | 38.7% | 39.6% | 39.7% | −1.8 |
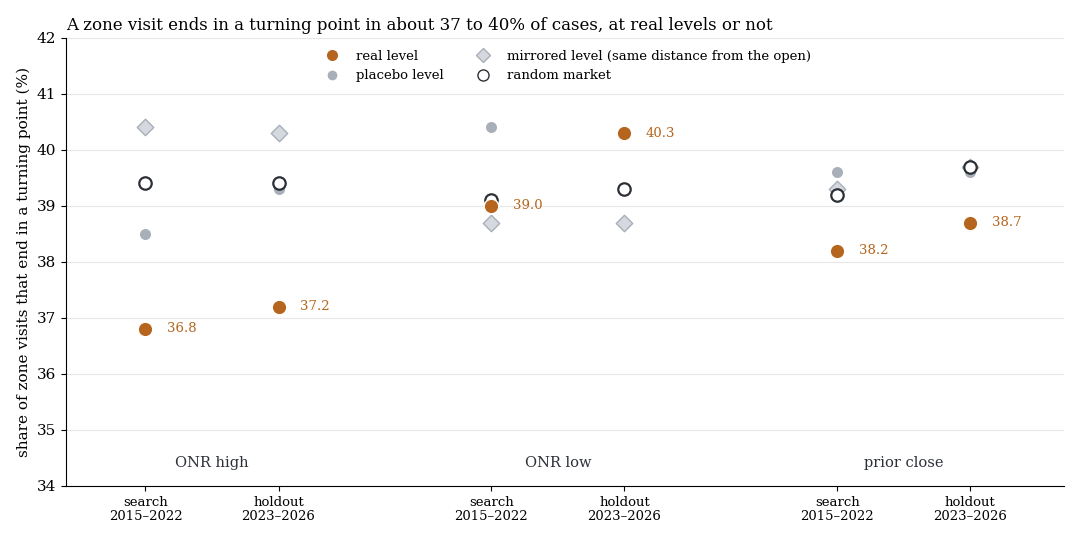
Share of zone visits that end in a turning point inside the zone. Orange: real level, grey: placebo, diamond: level mirrored at the open, open circle: random market.
Whether the level is real, a placebo, a mirrored level or a random market: a visit ends in a turning point in roughly 37 to 40% of cases. The real level sits slightly below, at the ONR high −1.6 percentage points in the search period and −2.1 in the holdout. No market is positive with |t| ≥ 2, and in none of the eight years is the difference positive at the ONR high, the ONR low or the prior close.
4. Robustness and holdout
All 27 zigzag cells (three thresholds, three zone widths, three levels) sit at zero or below when pooled. Fractals (5 candles left and right, 5-minute candles) have no consistent sign: ONR high and prior close slightly positive with all t < 2.5, the ONR low negative. Of 1,080 visit tests, 217 pass the multiple-testing correction, 176 of them with a negative sign. The 15 positive ones are single markets or fractals with a wide zone (t 2.2 to 3.6), none of them in the primary specification.
The holdout ran exactly once. A cluster counted as confirmed only if both differences were positive, real minus placebo and additionally against the random market, each with t ≥ 2. No level meets that. The ONR high again sits significantly below the placebo (−2.1 percentage points, t −4.0). The only positive sign, the prior-day low with +1.1 points (t 1.7), is not significant and was negative in the search period (−0.8, t −1.8).
What it means
The small cluster around the line is real as a count: 7 to 25% more turning points than at a level next to it. But it comes from price spending more time near the overnight high and the prior close, and a random market produces it just the same. The eye sees the turning points at the level because it does not count the turning points next to it. Per visit there is no surplus, if anything a small deficit. A fade at the zone would therefore have no more reversals to expect than a fade at a random level. We did not run a trading test for that reason.
Limits
- CFD minute data (BID), no futures. US CFDs have no quotes from 16:15 to 18:00 ET, so the night is incomplete there. ONR levels exist only on days with at least 550 overnight minutes: in the search period about 61% of the DAX and FTSE days and about 63% of the US days, in the holdout almost all.
- “Turning point” is a definition. We tested zigzag from 0.10 to 0.25 ATR and fractals, zones from 0.03 to 0.10 ATR. Other definitions (candle patterns, volume) are not tested.
- The count is retrospective. A pivot is only fixed after the counter-move. That is deliberately the optimum for the claim, and even so nothing shows.
- Explanation open. The small deficit per visit may partly come from real levels being visited more often at the start of the day, when price runs through. We did not break that down, because it does not change the question.
- Not tested: level clusters (ONR high near the prior close), time-of-day dependence, trend days, other markets (CAC, SMI, Asia), gold and FX.
All pattern families of the scan in the overview. Related: Fibonacci zones against the random walk, the random yardstick, the overnight drift.
Disclaimer: Historical statistics are no guarantee of future market behaviour. This study is not investment advice. Trading carries a risk of loss up to total loss.