Data basis: DAX, FTSE, Dow, NQ and SPX in the cash session; Dukascopy CFD minute data (BID). Search period 2015–2022 for all management tests, holdout 2023 to June 2026 only for the one remaining observation (gap-and-go), one run. 3,780 management policies (initial stop, adding, trailing, re-entry, time window), 61,793 logged tests. Costs: a fixed round trip of spread plus slippage per unit (DAX 2.5, FTSE 1.5, Dow 4.0, NQ 2.5, SPX 0.8 points), every added unit pays in full. Benchmarks: a random market with five draws (every minute candle mirrored around its open with probability ½, see the random market as a ruler), random direction on real data, and “always long” on the same days. No trading recommendation.
Tom Hougaard stands for three rules. The stop is tight: in his articles it is 20% of the daily ATR, 10% on quiet markets with a tight spread. Winners are added to, losers never (“Best Loser Wins”, 2022). And there are fixed setups such as the “School Run” in the DAX, the breakout from the 15-minute candle between 09:15 and 09:30.
The lesson behind it is popular because the arithmetic holds: if you keep losses small and let winners run, you can make money with many failed attempts. But does the management create an expectancy, or does it only shape the distribution of results? Only a market with nothing to harvest can show that. There, every rule must end at minus costs. We rebuilt Hougaard's building blocks mechanically and ran them against random markets. That tests the translation into rules, not the trader.
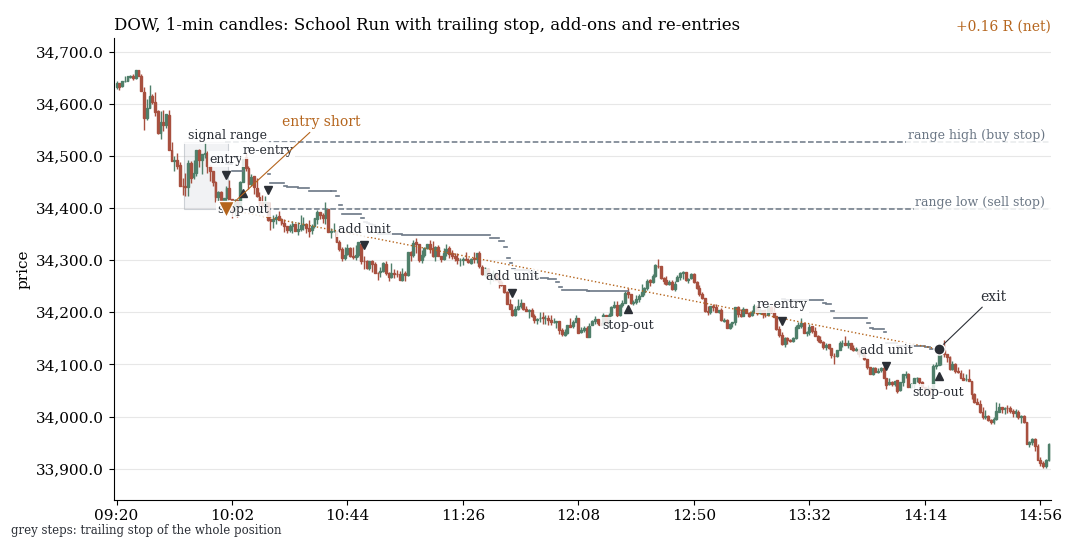
School Run in the Dow on 22 Apr 2022 (excerpt): short breakout, three add-ons, two re-entries and a trailing stop (grey steps). Result: +0.16 R net.
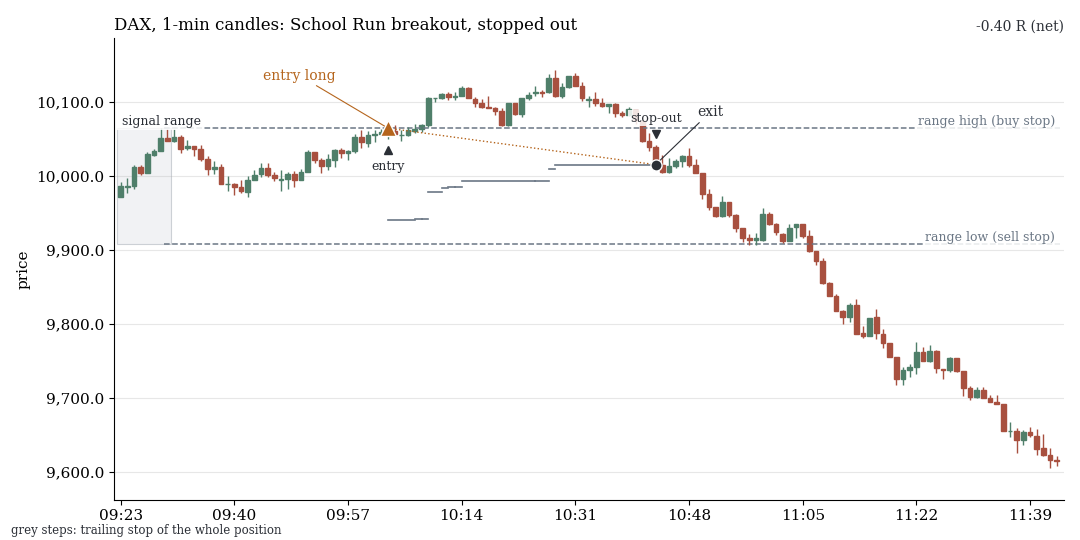
Long breakout in the DAX on 25 Mar 2020: the price turns and the trailing stop is hit (−0.40 R net). Both days are from the 2015–2022 search period, drawn at random (fixed seed) from all 9,921 trading days of the rule, not picked.
1. On a random market, management only pays costs
If the price is a martingale, every rule built from stops, trailing, re-entry and adding has a gross expectancy of zero. Management shapes the distribution, many small losses and a few large wins, and pays costs per unit. R is the initial risk of one unit. Across five random draws, all 18,900 combinations of policy and market land at +0.02 R gross and −0.238 R net, with costs of 0.258 R.
| Signal | Random market gross | Costs | Random market net | real gross | Costs | real net |
|---|---|---|---|---|---|---|
| Direction of the first 15 minutes | +0.001 | 0.252 | −0.251 | +0.108 | 0.268 | −0.160 |
| School Run | +0.012 | 0.243 | −0.231 | +0.081 | 0.258 | −0.176 |
| all signals | +0.020 | 0.258 | −0.238 | +0.072 | 0.276 | −0.204 |
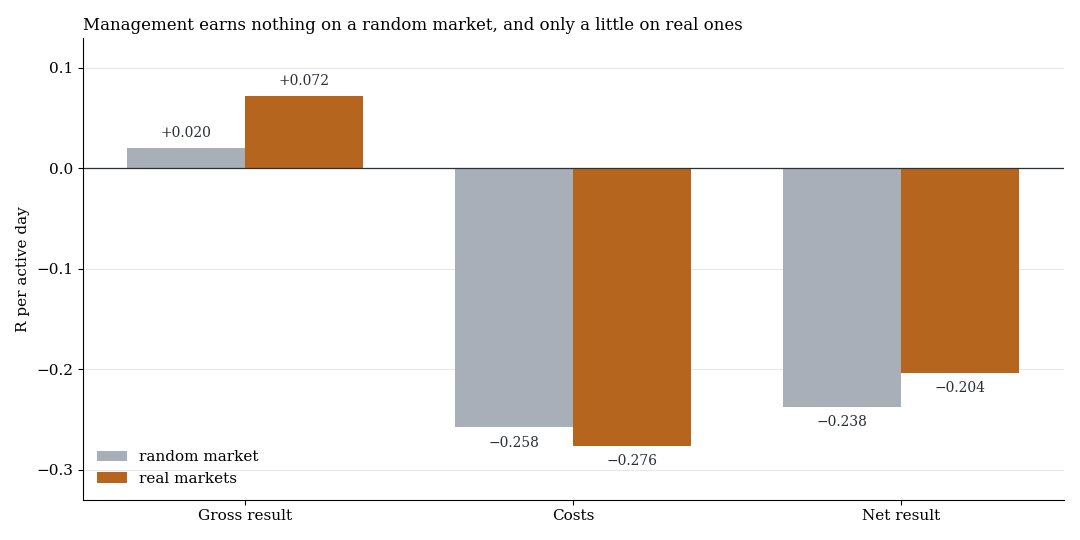
Mean over all 3,780 policies and five markets, in R per active day. On the random market (grey) the gross result is zero, on real markets (orange) it is +0.072 R. Costs take all of it.
2. On real prices there is trend continuation, but less than the costs
To measure persistence we start a point every 30 minutes. If the price moves x ATR away from it, we ask: does it move another x ATR before returning to the start point? A random walk says 50%.
At 0.1 ATR, the zone of Hougaard's tight stop, the market is pure chance: 50.6% against 50.9% in the random market. At 0.2 ATR it is 51.6% (t 2.8). From 0.3 ATR the price continues more clearly, 52.4% against 50.5% (t 3.4), at 0.5 ATR 53.9% against 50.6% (t 3.0). At 0.3 ATR the difference is positive in all 8 years.
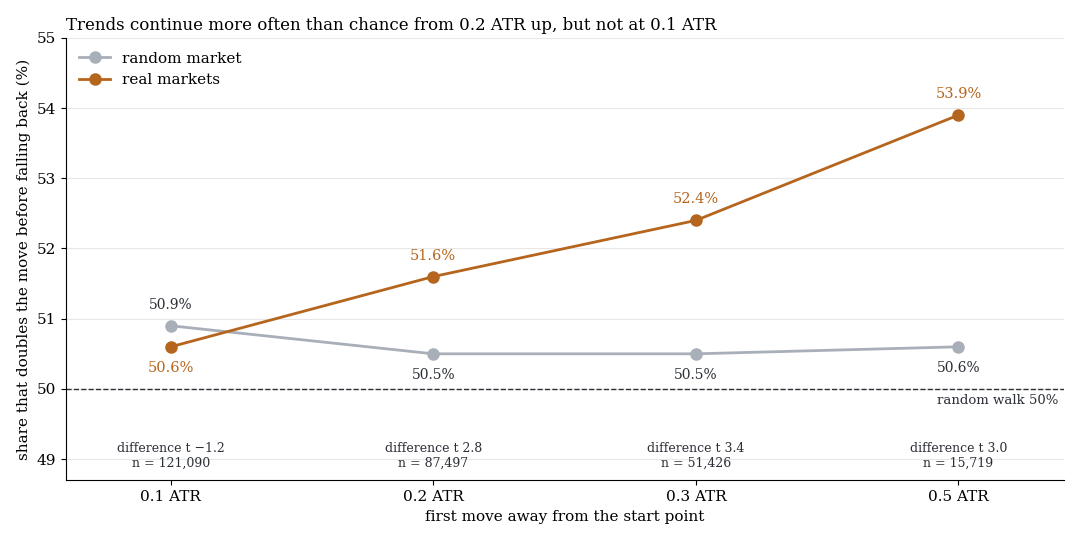
Share of moves that go on by the same amount before the price returns to the start point (five markets, all start times). Orange: real markets, grey: random market.
Costs decide whether that is tradable. For entry after +x, stop at the start point and target at +2x, you need 52.3–54.2% (x = 0.3) or 51.4–52.6% (x = 0.5), depending on the market. The measured values sit at or just above that threshold. Traded directly, they leave +0.02 to +0.03 R gross per trade and −0.02 to −0.05 R net. None of the 96 net cells is significantly positive.
3. What stop, adding and trailing bring individually
Of 30,240 net tests across the whole grid, none reaches t > 2, the maximum is 1.84 (DAX, +0.048 R per day). 92–98% of the policies are net negative. Against the random market, by contrast, 850 of 23,520 comparisons pass the multiple-testing correction, typically with +0.05 to +0.15 R per day.
| Building block | Level | real net | Random market net | Difference |
|---|---|---|---|---|
| Initial stop | 0.1 ATR | −0.371 | −0.417 | +0.046 |
| 0.2 ATR | −0.148 | −0.189 | +0.041 | |
| 0.3 ATR | −0.094 | −0.121 | +0.027 | |
| Adding | none | −0.145 | −0.173 | +0.028 |
| up to 2 units | −0.206 | −0.245 | +0.039 | |
| up to 4 units | −0.223 | −0.264 | +0.040 | |
| Time window | first 2 hours | −0.220 | −0.225 | +0.006 |
| whole day | −0.190 | −0.260 | +0.070 |
R per day, all five markets, mean over the other building blocks. Adding harvests only about +0.01 R more but costs 0.06–0.08 R more. Tight stops are the most expensive. Loose rules over the whole day harvest the most, a trailing stop of 0.1 ATR almost nothing (+0.003 R).
Decomposing the row with the largest lead over the random market shows why net stays at zero. The same policy with random direction returns −0.054 R on real prices, with the direction of the first five minutes +0.004 R, the random market −0.120 R. Management extracts +0.066 R per day from real paths even with random direction, because trends are carried along in both directions, and the direction adds +0.058 R. That offsets the costs exactly.
The School Run in the DAX sits at −0.019 R per day (t −0.4). The pre-specified managed variant (stop 0.2 ATR, two add-ons, trailing 0.2 ATR, re-entry) makes −0.149 R across all markets (t −4.9), the random market −0.250 R.
4. Gap-and-go: the one lead does not hold in the holdout
Among 61,793 tests one observation remained: the breakout from the 15-minute range in gap direction, only on days with a gap of at least 0.3 ATR, fixed stop 0.2 ATR, no management. In the search period: 2,271 trades, +0.167 R (t 2.85), positive in 7 of 8 years. The warning signs were there early: the cell was the best of 10 filters × 4 bases × 8 groups, the trimmed mean was −0.082 R, and a plain long breakout on the same days earned +0.121 R (difference t 1.3). The gain came from rare days on which several indices gap widely at the same time (day-mean series: +0.031 R, t 0.64).
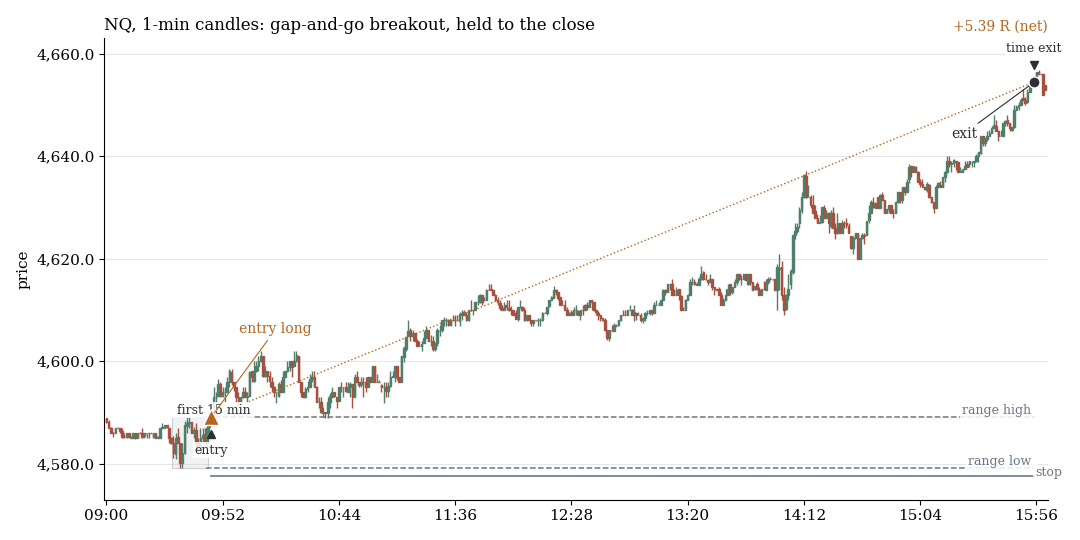
Gap-and-go in the NQ on 18 Nov 2015: breakout to the upside, held to the close (+5.39 R net).
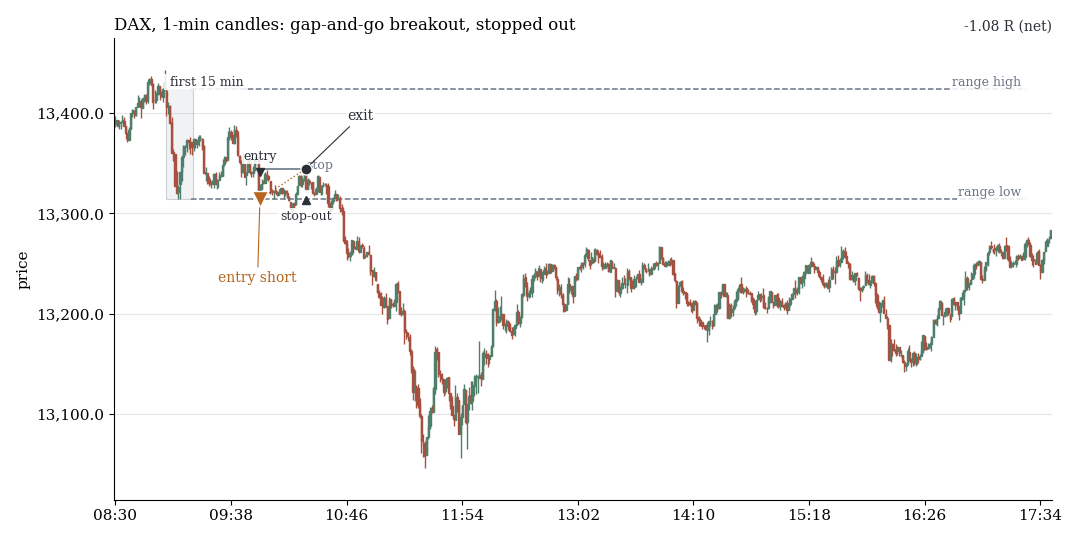
Gap-and-go in the DAX on 21 Dec 2020: breakout to the downside, stopped out (−1.08 R net). Both examples were drawn at random with a fixed seed from all 2,270 cases of the search period.
We rebuilt the rule independently and reproduced it exactly in the search period. In the holdout 2023 to June 2026, a single run, the sign flips: 901 trades, −0.087 R (t −1.15, one-sided p 0.88), already −0.023 R gross. The 95% interval [−0.235; +0.061] excludes +0.167, all five markets are negative in R, and the direction against the gap (+0.07 R) does better than the gap direction (−0.02 R).
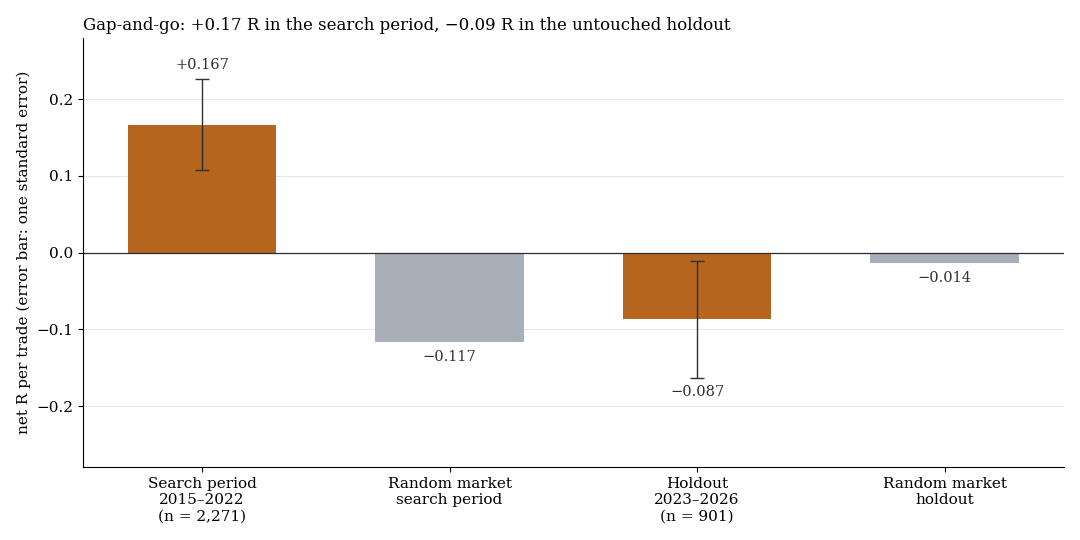
Net R per trade of the gap-and-go rule in the search period and in the holdout, each against the random market. Error bars: one standard error.
What it means
Management shapes the curve, it does not create an expectancy. On real prices there is a small real advantage, trend continuation from about 0.2 to 0.3 ATR, and management harvests it, but only as much as the spread costs. Adding also creates peak risk: in one variant 15.9 R were open at times in a single position.
What makes Hougaard himself earn, we cannot measure. Day selection, order flow, size on the best days, holding overnight and real futures costs do not form a rule. We also see only the traders who survived, which says nothing for or against their method. The data only imply: if it works in the long run, then not as a mechanical management rule. At the Tokyo fix, the scan's only finding with a real counterparty, management also made the result worse.
Limits
- CFD minute data (BID), fixed costs. Within a minute the unfavourable case applies (adding first, then the stop). Real fills are more likely worse.
- The random market is not a perfect null model. It also destroys micro reversal, so part of “real minus random market” is path shape, not direction. The decomposition with random direction shows that the path shape is trend persistence as well.
- Not tested: day selection, order flow, position-size ladder, other targets, holding overnight, CAC and gold.
- Search period 2015–2022, holdout only for gap-and-go (3.4 years, one regime, power about 60% at full effect size). Patterns that only arose from 2023 are invisible.
All pattern families of the scan in the overview. Related: exit on the second counter-candle, the study on exit logic and take profit at levels against trailing stop.
Disclaimer: Historical statistics are no guarantee of future market behaviour. This study is not investment advice. Trading carries a risk of loss up to total loss.