Data basis: 15 markets (DAX, FTSE, CAC, SMI, Dow, NQ, SPX, JPN225, HK50, AUS200, gold, EURUSD, GBPUSD, USDJPY, BTCUSD), Dukascopy CFD minute data (BID) on a common UTC axis. Search period 2015–2022, one candidate in the separate holdout 2023 to 5 June 2026. Costs per market as a round trip of spread and slippage (DAX 2.5 points, FTSE 1.5, HK50 7, JPN225 11, BTCUSD 10 basis points), indices outside their cash session times 2.5. Benchmarks: a random market with identical code (every minute candle mirrored at its open with probability ½, in all markets at once, so only predictability over time disappears) and the drift “always long” and “always short”. Signals only from completed candles. No trading recommendation.
“One market leads, the other follows.” It is an old idea in intraday trading: Asia runs ahead of Europe, the US after-hours session sets the tone for Hong Kong, and when two related markets drift apart, the laggard catches up. The idea has a real mechanism: information reaches one market first while the others trade thinly or are closed.
We tested four versions: the lead-lag matrix across all 15 markets, the handover between sessions, the spread between related markets (relative value) and catching up after large moves, each against our random market. Result: lead-lag and follow-through exist, but nowhere are they large enough to pay for costs. Handovers and relative value do not even show that.
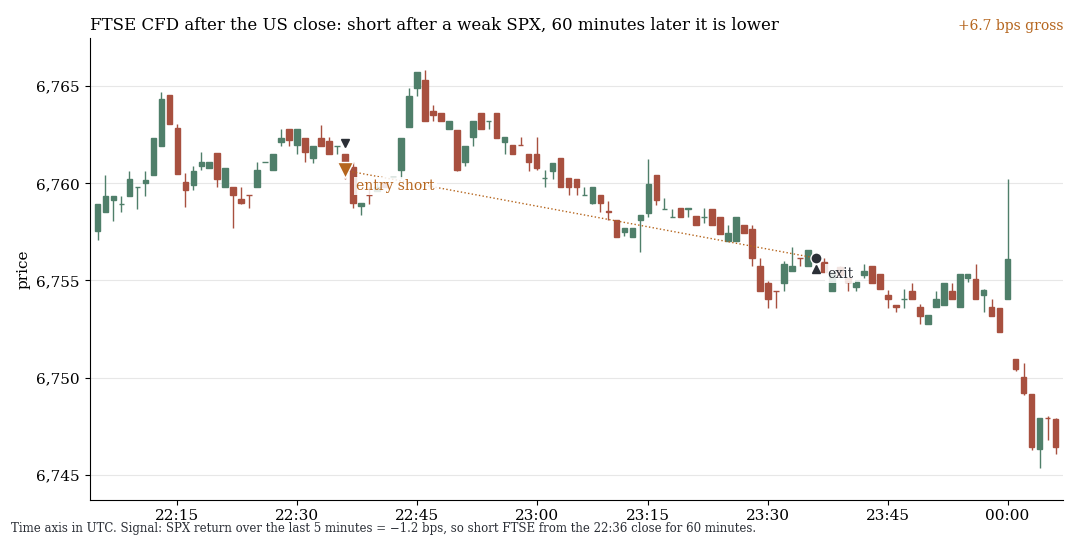
FTSE CFD, 1-minute candles, UTC. The SPX lost 1.2 basis points over the last 5 minutes, so the rule goes short for 60 minutes (orange: entry). Result: +6.7 basis points gross.
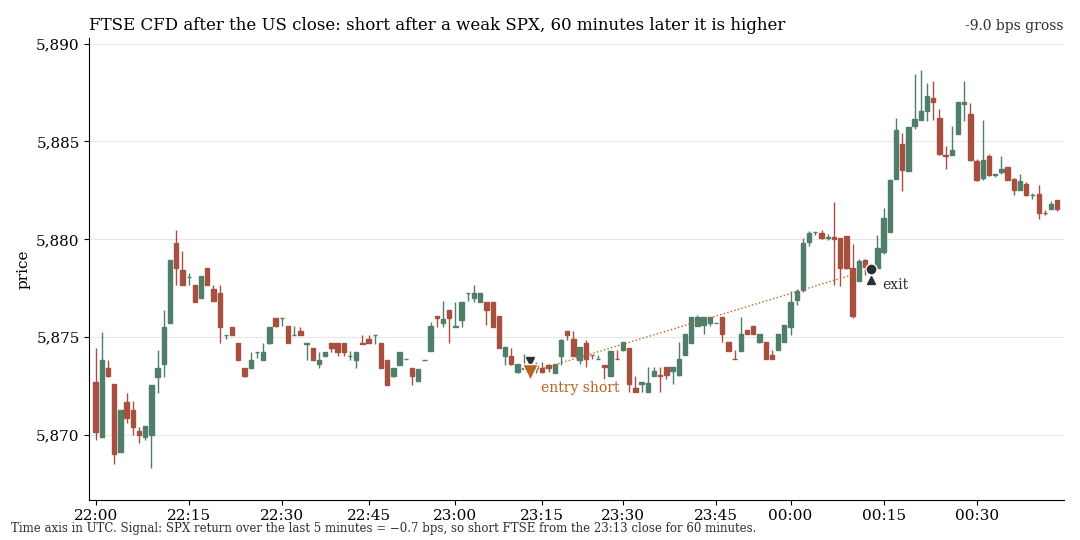
Same rule, a losing case: −9.0 basis points gross. Both cases come from 2015–2022 and were drawn at random from all detected cases with a fixed seed, not picked. On average the follow rule loses 0.72 basis points per decision: the FTSE tends to reverse US moves.
1. Lead-lag: real structure, small size
The matrix covers 210 ordered pairs, five signal and five holding lengths (1 to 60 minutes) and twelve two-hour windows: 58,070 cells with at least 2,000 decisions. The signal is the sign of the last return in market A, market B is traded, gross. 291 cells reach an absolute t above 4, against 3 on the random market.
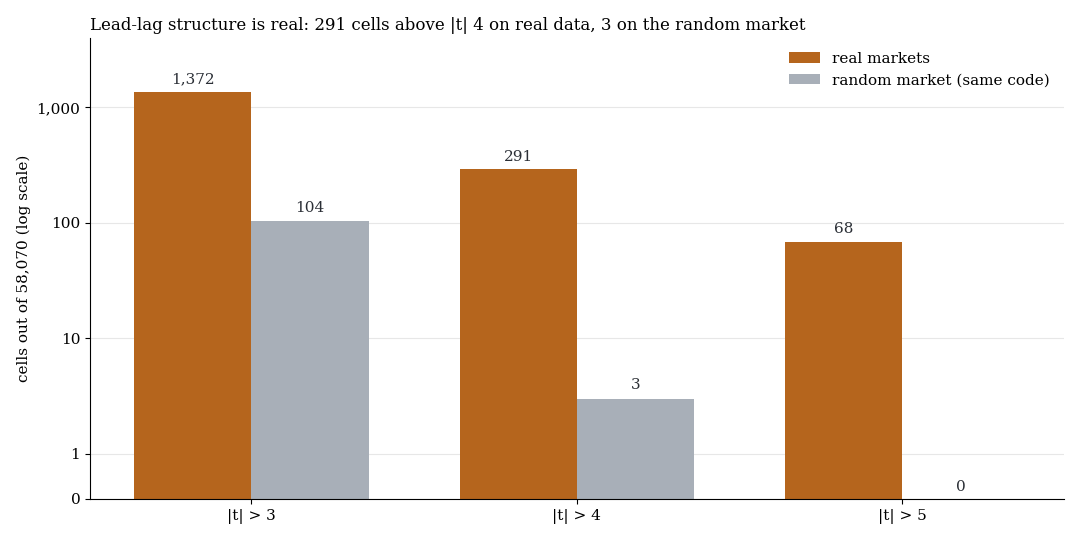
Cells by absolute t, real markets (orange) against the random market (grey), logarithmic axis. Above t 4 there are 291 real cells against 3.
The followers are almost all markets outside their own cash session. At holding times of 5 minutes and more, cells beyond the random maximum sit mainly in the FTSE at night (65), the HK50 after the Hong Kong close (29) and the DAX in the Asian night (14). 56 cells continue the direction, 76 reverse it. Costs are 1.2 to 5.4 basis points per round trip (2.5 times as much outside the cash session), the gross return per decision mostly 0.03 to 1.2. The largest ratio of gross return to cost among all cells with t above 4 is 0.58. We require at least 2.
2. Handovers, relative value, catching up
| Family | Tests | Threshold | real markets | random market |
|---|---|---|---|---|
| Lead-lag matrix | 58,070 | abs. t above 4 (gross) | 291 | 3 |
| Session handovers | 1,192 | abs. t above 3 (gross) | 7 | 3 |
| Relative value | 160 | net t above 1.5 | 0 | 0 |
| Catching up after moves | 5,027 | abs. t above 4 (gross) | 39 | 2 |
Handovers. The 1,192 daily tests (Asia, Europe, US and FX against each other) cannot be told apart from the random market. The largest absolute t is 3.71 against 3.68, and no test reaches net t 3. If the DAX follows the AUS200 cash session from 09:01 to 12:00 Berlin, that is +3.8 basis points gross (t 2.40) and +1.8 net (t 1.14). The one cluster, US against Asia the next morning (20 against 10), led to our holdout candidate.
Relative value. Ten pairs, a beta-hedged spread, costs of both legs. CAC / FTSE (gross 1.40 basis points against 4.76 of cost) and EURUSD / GBPUSD (1.95 against 1.88) show slight mean reversion. Net, none of the 160 tests reaches t 1.5; the best (+4.74, EURUSD / GBPUSD) rests on 92 trades at t 1.33.
Catching up. After moves of 3 to 4 standard deviations the second market does follow: 180 “follow” cells with absolute t above 3 against 14 on the random market.
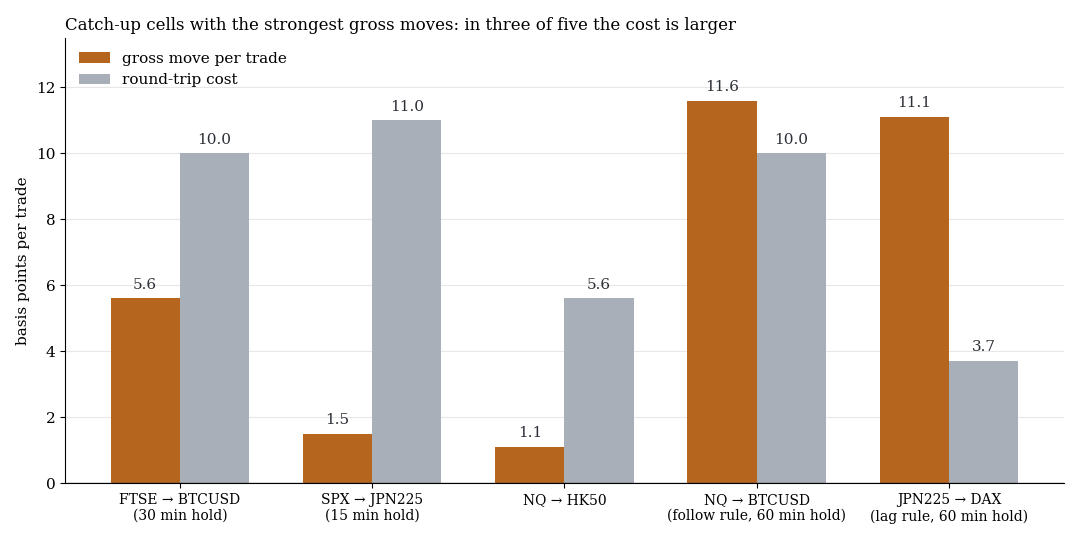
Gross move per trade (orange) against round-trip cost (grey) in five of the strongest cells, search period 2015–2022. Only NQ → BTCUSD and JPN225 → DAX sit above cost gross, and both fail the depth checks.
NQ → BTCUSD ends at +1.6 basis points net (t 0.55) and works in 2 of 6 years. JPN225 → DAX (+7.4 net, t 2.08) is a spike, not a plateau: neighbouring variants sit at +0.6, +0.4 and −1.4, and without the five best days only +1.4 remains.
3. The one holdout candidate: HK50 against a strong US day
After a strong US cash day (Nasdaq return more than one rolling standard deviation from zero) the HK50 is traded against the US direction the next morning, 09:31 to 11:55 Hong Kong. Discovery showed +10.96 basis points net (t 2.86) and 8 of 8 positive years, 2022 only +0.2. Its t sits below the random maximum of the 1,192 daily tests (3.68).
| Measure | Discovery 2015–2022 (n 373) | Holdout 2023–2026 (n 177) |
|---|---|---|
| net per trade (basis points) | +10.96 | +4.13 |
| t (Newey-West) | 2.86 | 0.55 |
| median net | +4.29 | −3.11 |
| “always long” on the same days | −6.85 | +8.75 |
| short after a US up day | +13.75 | −7.66 |
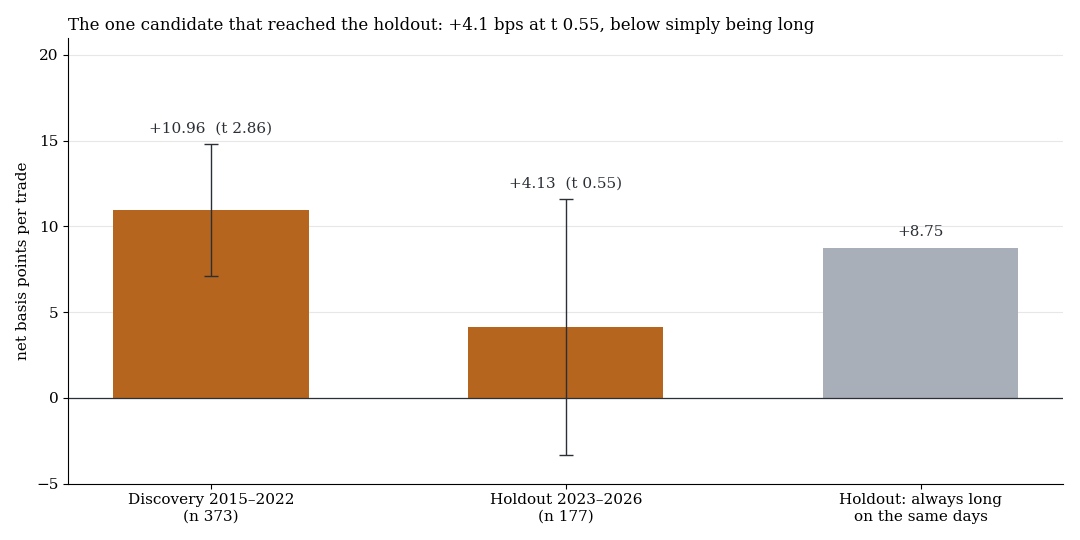
Net return per trade in basis points, error bars one Newey-West standard error. Grey: “always long” on the same holdout days, without error bars.
The holdout says zero. The rule sits 4.6 basis points below “always long” on the same days, the median is negative, and the short side that carried the discovery loses. The gain comes from the long side, the HK50 morning drift of 2023 to 2026. Formally the sign held, in substance nothing is confirmed. Power against the full discovery effect was about 43%.
What it means
Lead-lag is real, but it sits at 0.1 to 6 basis points where costs are 2 to 11. Almost everywhere the open market leads the CFD whose cash session is closed. That describes how thin night quotes process information, not a tradeable gap. Catching up and relative value fail at the same point: what converges does so in fractions of the cost. This agrees with our studies on the DAX not catching up with the FTSE and the colour agreement of index pairs.
Limits
- CFD minute data (BID). Thin night quotes on Dukascopy go stale and create lead-lag that need not exist at another broker. US index CFDs have no quotes between 16:15 and 18:00 ET, the JPN225 has Tokyo-open data only from 2018.
- Fixed cost model. The factor 2.5 outside the cash session is an assumption.
- Not tested. Second-level lead-lag, news and calendar conditions, holding periods beyond one day.
- Small samples, many tests. The candidate (n 177) is the best of about 6,600 tradeable tests. The log holds 64,676 rows, and cells within a family are strongly correlated.
- Discovery against holdout. Only one candidate ran in the holdout, all other numbers come from 2015–2022.
All pattern families of the scan in the overview. Related: SMI, CAC 40 and CA60 against the same method.
Disclaimer: Historical statistics are no guarantee of future market behaviour. This study is not investment advice. Trading carries a risk of loss up to total loss.