Data basis: DAX, FTSE, CAC, Dow, NQ, SPX; Dukascopy CFD minute data (BID) of the cash sessions in local time. Search period 2015–2022 (1,982 to 2,044 days per market), holdout 2023 to Jun 2026 (848 to 880 days, one run). Start = return from the cash open over the first 60 minutes (variant 30), without the overnight gap. End = last 60 minutes (variant 30), in Europe ending 5 minutes before the closing auction. Costs: spread plus slippage (DAX 2.5, FTSE 1.5, CAC 1.5, Dow 4.0, NQ 2.5, SPX 0.8 points), 1.6 to 3.4 basis points per trade in the search. Benchmark: random market with identical code (each minute candle mirrored with probability ½). No trading recommendation.
“If the start is negative, the last hour is negative too.” The rule of thumb sounds plausible: a weak start shows who controls the market, and that pressure persists. It is widespread because people remember days that start weak and end weak, and because research knows a version of it: Gao, Han, Li and Zhou report that the first half hour predicts the last.
We asked the question as a number: how often do the first and the last hour share a sign, and is the last hour negative more often after a negative start than otherwise?
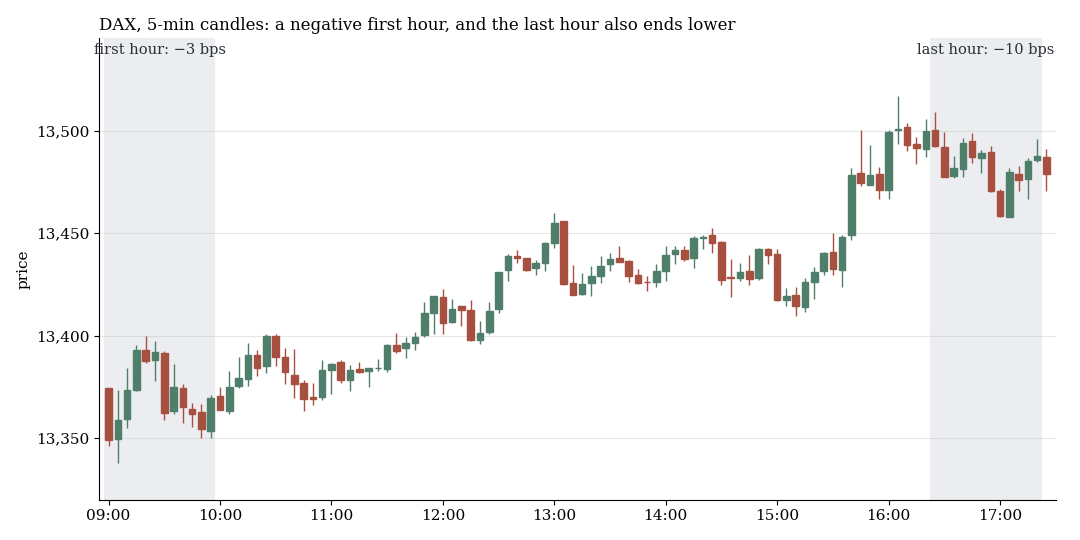
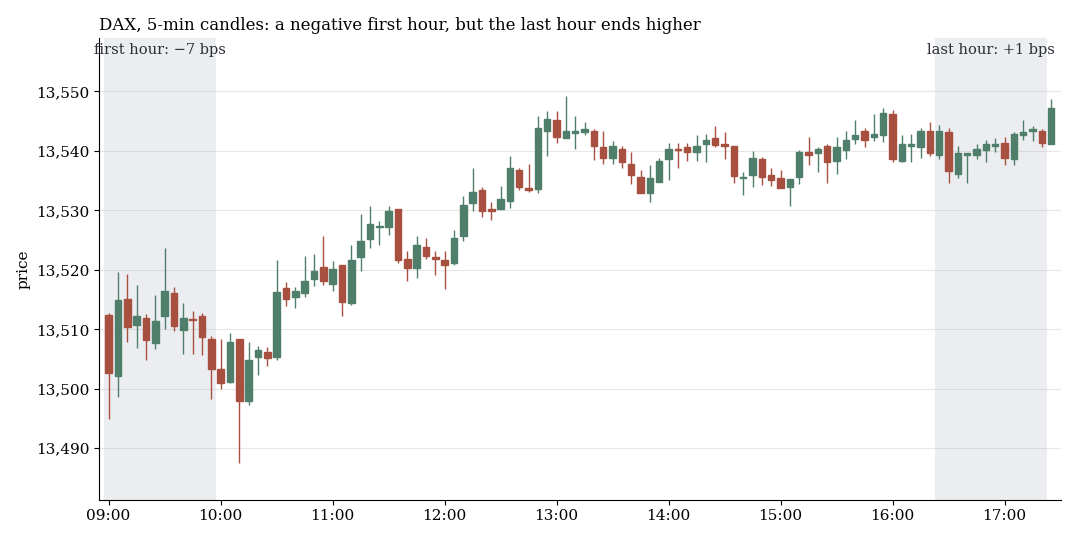
Two DAX days with a negative first hour, first and last hour shaded. On 29 Jul 2022 the first hour falls 3 bps and the last 10 bps; on 20 Jan 2020 the first falls 7 bps and the last rises 1 bp. From the DAX days with a negative start, one day with a negative and one with a positive end were drawn at random with a fixed seed (search period 2015–2022), not hand-picked. Two days prove nothing, the numbers below come from all days.
1. The question as a number
| Market | Days | Base rate: last hour negative | after a negative start | Same sign | Correlation |
|---|---|---|---|---|---|
| DAX | 2,042 | 47.5% | 48.0% | 50.5% | +0.007 |
| FTSE | 2,026 | 46.8% | 45.8% | 49.2% | −0.045 |
| CAC | 2,030 | 46.2% | 45.9% | 49.8% | −0.025 |
| Dow | 1,988 | 49.8% | 48.3% | 48.5% | +0.009 |
| NQ | 1,988 | 48.7% | 49.5% | 50.8% | +0.020 |
| SPX | 1,982 | 50.5% | 48.9% | 48.5% | +0.004 |
| Random market, range | about 2,000 each | 49.2–50.8% | 48.1–52.8% | 48.9–51.9% | −0.036 to +0.097 |
First and last hour, search period 2015–2022. After a negative start the last hour is negative in 45.8 to 49.5% of cases. The base rate is 46.2 to 50.5%, and in four of six markets the conditional value is even below it. The signs agree on 48.5 to 50.8% of days, while a random market delivers 48.9 to 51.9%. The correlation of start and end is practically zero in all six markets.
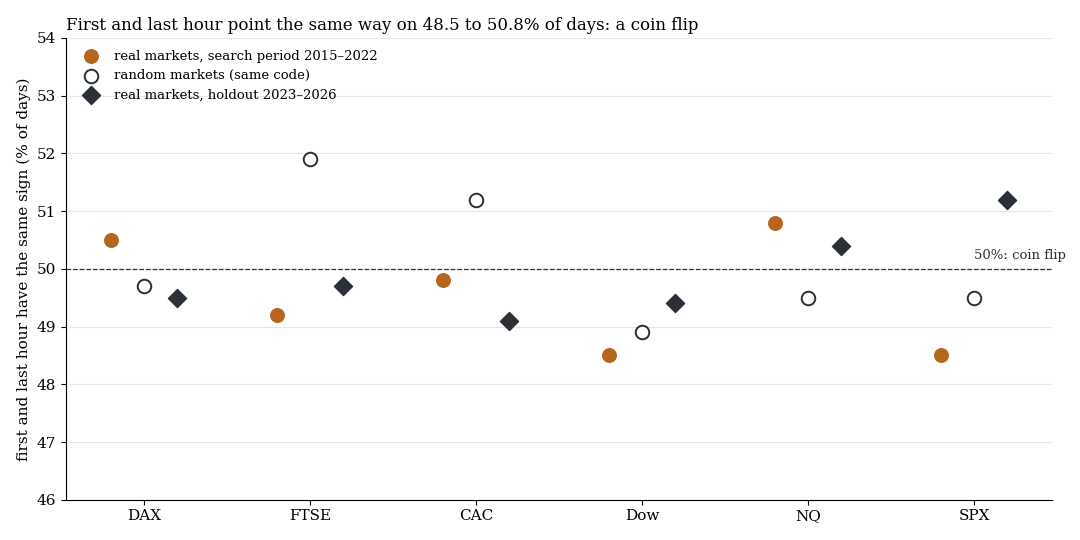
Orange: real markets, search period 2015–2022. White: random markets with the same code. Dark diamonds: holdout 2023–2026. The dashed line is the coin flip at 50%.
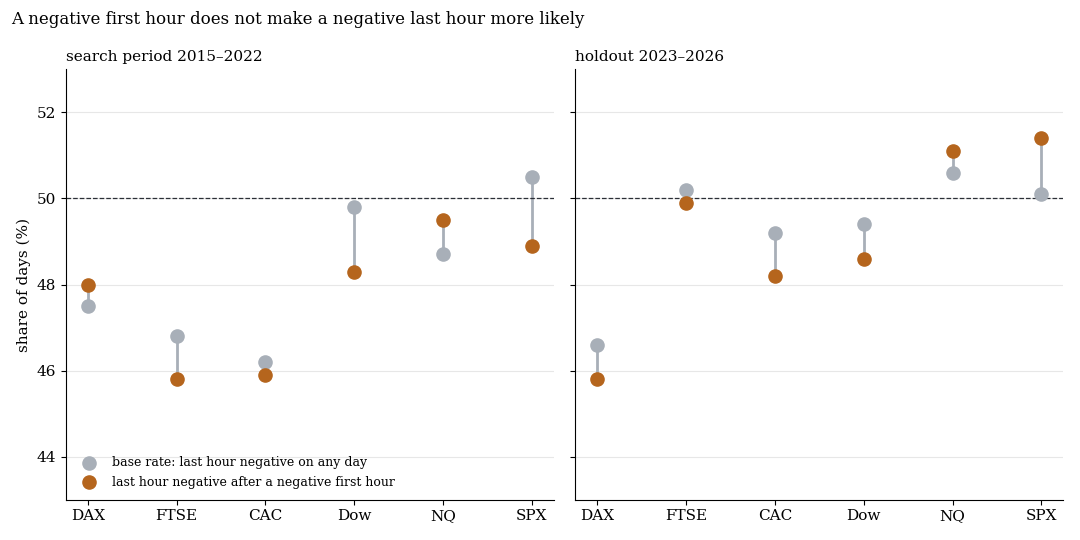
Grey: share of days with a negative last hour. Orange: the same share after a negative first hour. Search period on the left, holdout on the right, dashed line at 50%.
2. Also in the holdout and with other window widths
| Variant (start/end in minutes) | Same sign | Correlation | Rule net (bps) |
|---|---|---|---|
| Search, 60/60 | 48.5–50.8% | −0.045 to +0.020 | −3.6 to −1.0 |
| Search, 30/30 | 48.0–51.2% | −0.111 to −0.004 | −3.5 to −1.7 |
| Search, 60/30 | 48.7–50.5% | −0.089 to +0.031 | −3.9 to −1.6 |
| Random market, 60/60 | 48.9–51.9% | −0.036 to +0.097 | −5.0 to −1.2 |
| Holdout, 60/60 | 49.1–51.2% | −0.029 to +0.041 | −3.1 to 0.0 |
The ranges are over the six markets. No market, window width or period shows the start carrying through to the end. In Europe the afternoon rather turns slightly against the first 30 minutes: the correlation is −0.055 (DAX), −0.111 (FTSE) and −0.077 (CAC), gross about 1 bp, far below the costs of 2.0 to 2.8 bps. That matches the closing-momentum rule of Baltussen et al., which we tested (gross about 1 bp, reversed in the holdout), and our replication of the Gao paper in Market Intraday Momentum, Replicated.
3. The trading rule loses after costs
| Market | Costs (bps) | Search: rule net (t) | Search: short only after a negative start | Holdout: rule net |
|---|---|---|---|---|
| DAX | 2.02 | −1.0 (t −1.4) | −1.3 | −2.0 |
| FTSE | 2.11 | −2.6 (t −4.5) | −3.1 | −1.9 |
| CAC | 2.83 | −3.2 (t −4.5) | −3.6 | −3.1 |
| Dow | 1.58 | −2.5 (t −2.9) | −2.4 | −1.1 |
| NQ | 3.42 | −3.6 (t −3.7) | −3.4 | 0.0 |
| SPX | 2.85 | −3.4 (t −3.9) | −3.3 | −1.3 |
“Rule” means trading the last hour in the direction of the first. It loses 1.0 to 3.6 bps per trade in all six markets of the search. The short variant, shorting the last hour only after a negative start, loses 1.3 to 3.6 bps, again everywhere. In the holdout the rule sits at 0.0 to −3.1 bps and the short variant at −0.6 to −2.5 bps, only in NQ at +0.6 (t 0.4). In a random market the same rule loses 1.2 to 5.0 bps, roughly the costs: the start carries no information about the end.
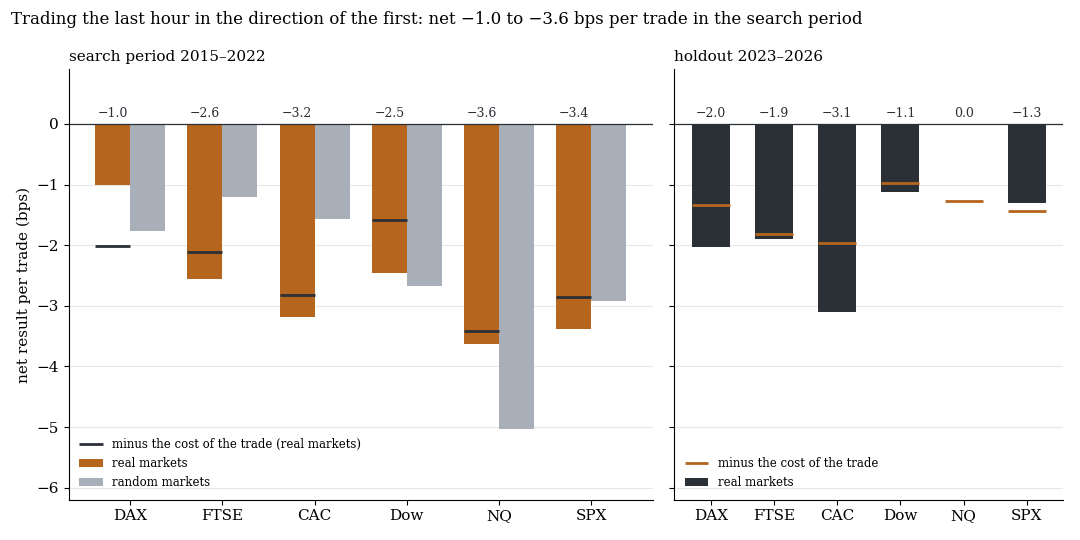
Mean net result per trade in basis points. Orange: real markets in the search, grey: random markets. Horizontal marks: minus the costs per trade. Holdout (dark) on the right.
What it means
The start does not predict the end, in no market, no window width and no period. If anything, the afternoon in Europe turns slightly against it. The rule of thumb describes what people remember: days that start weak and end weak stand out. They are not more frequent than chance delivers them. Anyone who shorts the last hour after a negative start pays costs for a coin flip. This fits our studies on the first candle and on intraday momentum: what seems to know more at the start is arithmetic (the candle sits inside the day) or the overnight gap.
Limits
- CFD minute data (BID), no ticks. The EU close is the auction price, so the last hour ends 5 minutes earlier in Europe and 1 minute earlier in the US.
- Only sign and mean tests. We did not condition on the size of the start here. Large starts were examined in two other tests of the scan, also without a result.
- Start measured without the overnight gap. With the gap, DAX and FTSE show a slope that sits in the gap (see the intraday momentum study).
- Three pre-set window combinations, all reported. One random-market draw as null reference, holdout only for 60/60 (one run).
- Not tested: gold, FX and Asia, trading inside the hour, entry filters.
All pattern families of the scan in the overview. Related: Does the First Candle Set the Day?, Market Intraday Momentum, Replicated, Trend-Day Detection via the 2nd Opening Candle.
Disclaimer: Historical statistics are no guarantee of future market behaviour. This study is not investment advice. Trading carries a risk of loss up to total loss.