Data basis: Minute data of the index CFDs on the S&P 500, Nasdaq 100 and Dow (Dukascopy, BID, US cash session) and daily closes of the VIX (Yahoo Finance), VXN and VXD (Cboe). Search period 2015–2022 (1,972 to 1,975 days per market). The holdout, 2023 to 5 June 2026 (a window evaluated exactly once, after the rule was fixed), was read for one rule only. Costs per round trip: 0.8 points (S&P 500), 2.5 (Nasdaq), 4.0 (Dow). Benchmarks: random market (each minute candle is mirrored at its open with probability ½: same volatility, no direction), normal distribution, placebo days. No trading recommendation.
The expected move (EM) is the daily range the options market prices in: price times implied vol, divided by √252 (the common formula in GEX tools, gamma exposure). Many see it as the day’s guard rail: the market “holds” it, and its edges mark the high and the low.
First: it comes from option prices, not from open interest. The walls built from open contracts per strike are a different claim, which we cannot test because historical open-interest data are missing.
The band sits around the prior close, k times the EM wide (k = 1 is the hypothesis, 0.75 and 1.25 are controls). Implied vol is the last close of the vol index before the trading day. One R is the distance to the stop, and a t-value from 2 on counts as notable.
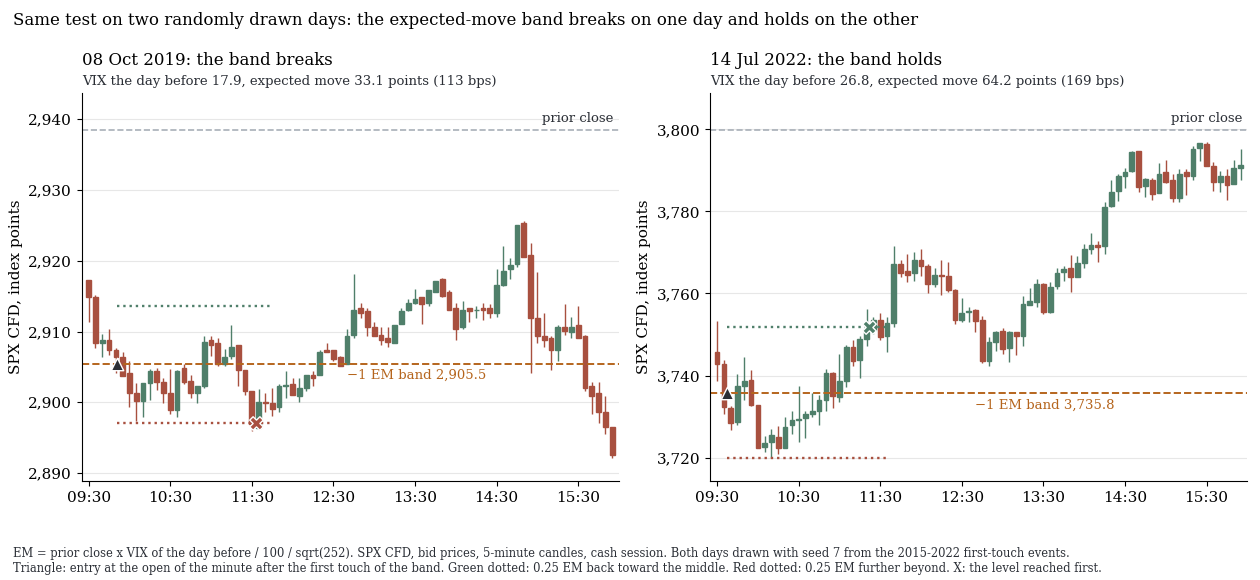
SPX, 5-minute candles. Left, 8 October 2019 (VIX 17.9, EM 33.1 points): after the touch the price first runs 0.25 EM further (red), the band breaks. Right, 14 July 2022 (VIX 26.8, EM 64.2 points): first 0.25 EM back (green), the band holds. Fixed seed (7), drawn from 238 breaks and 230 holds, not picked.
1. Is the expected move held? Yes, about 80% of the time, and so is a random market
The close stays inside ±1 EM on 80.1% of days, where the normal distribution expects 68.3%.
| Band around the prior close | Close inside: real | Random market | Normal distribution | Whole range inside: real / random |
|---|---|---|---|---|
| ±0.75 EM | 68.4% | 68.7% | 54.7% | 45.3% / 42.7% |
| ±1.0 EM | 80.1% | 80.7% | 68.3% | 65.2% / 63.4% |
| ±1.25 EM | 88.3% | 88.3% | 78.9% | 79.2% / 77.4% |
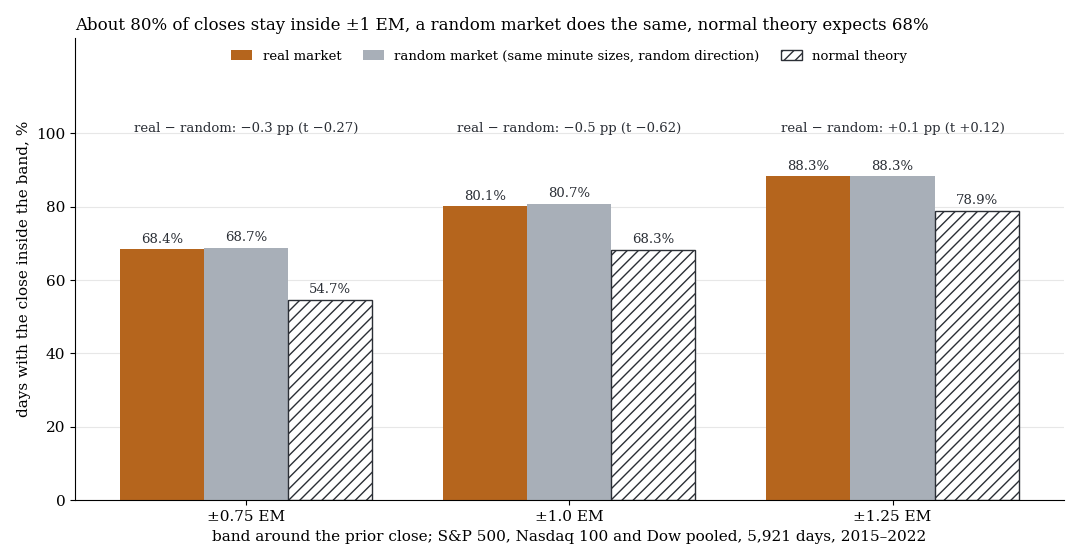
Close inside the band (S&P 500, Nasdaq 100 and Dow pooled, 5,921 days 2015–2022), above it real minus random with its t-value.
The reason is the volatility premium: the vol of the previous 20 days is at the median only 0.76 (S&P 500), 0.84 (Nasdaq) and 0.74 (Dow) of implied vol, so the band is wider than the actual dispersion. A random market with the same minute sizes but random direction holds just as often (−0.5 percentage points, t −0.6). The rate measures the vol level, not an effect of the band edge.
As a width measure the EM still works: a band of equal width from the realised vol of the last 20 days holds only 76.3% of closes. The share depends on the environment:
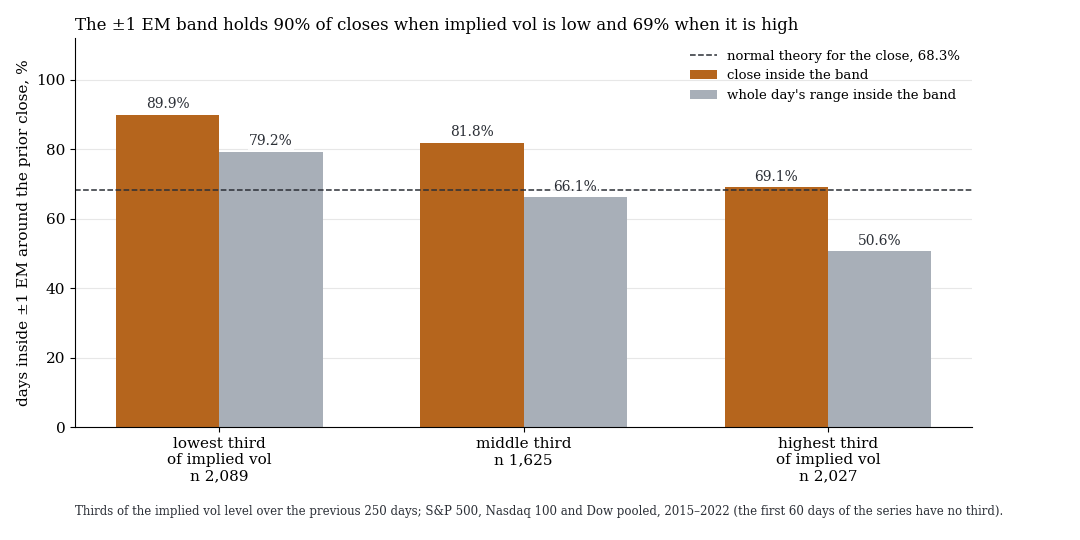
Share inside ±1 EM by third of implied vol (last 250 days): close in orange, whole range in grey. In the lowest third 89.9% of closes hold, in the highest 69.1%.
The whole range stays inside slightly more often in the real market (+1.8 percentage points at ±1 EM, t 1.8, at 0.75 and 1.25 EM t 2.7 and 2.1): the band is touched slightly less often.
2. Do the edges act as high or low? No, the band is not a barrier
If the band were a barrier, the price would run back after the first touch more often than in a random market. We test every first touch with the open inside the band: entry against the band at the open of the next minute, stop and target 0.25 EM each, exit by 15:59. If the price runs back first, the band held (random walk: 50%).
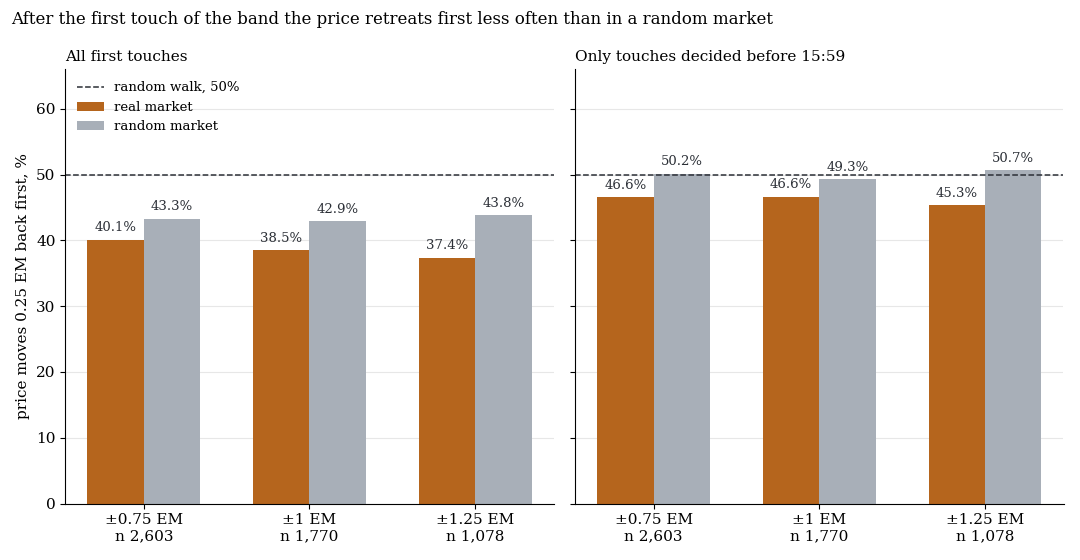
Share of first touches after which the price first runs 0.25 EM back. Left: all attempts. Right: only those decided before 15:59.
At ±0.75, ±1.0 and ±1.25 EM the price runs back first in 40.1, 38.5 and 37.4% of cases, in the random market in 43.3, 42.9 and 43.8%. After costs the rule loses −0.165, −0.163 and −0.177 R per trade (t −7.35, −6.06 and −5.46). The random market sits below 50% because 13 to 14% of attempts run out at 15:59 undecided: counting only decided attempts it is at 49 to 51%, the real market at 45 to 47%. The band does not slow the price, if anything it runs on slightly more often (no t-value of its own). Bands around the open show the same.
| Rule at ±1.0 EM (stop / target), n 1,770 | gross | net (t) | random market net |
|---|---|---|---|
| against the band, 0.25 / 0.25 EM | −0.067 | −0.163 (−6.06) | −0.127 |
| against the band, 0.5 / 0.5 EM | −0.070 | −0.118 (−4.77) | −0.073 |
| with the band, 0.5 / 0.5 EM | +0.070 | +0.022 (+0.89) | −0.043 |
All 15 rules against the band lose after costs, between −0.06 and −0.24 R per trade (t −2.3 to −7.3), also gross, also with the prior close as target (−0.107 R, t −3.77). Trading with the band sits at zero: six variants from −0.026 to +0.038 R (t −1.2 to +1.3), in the random market −0.04 to −0.10 R. Of 360 rule rows tested, 192 pass the multiple-testing correction (q ≤ 0.10, the error probability adjusted for the number of tests), 188 of them with a negative sign.
3. The one counter-trace: Nasdaq breakout long, no plateau, rejected in the holdout
One rule passed our pre-set candidate threshold (among others t ≥ 3, q ≤ 0.10, at least 6 of 8 years positive): Nasdaq, breakout long above the upper band, stop and target 0.5 EM. 311 trades, +0.118 R net (t 3.17, q 0.005), 8 of 8 years positive, +0.104 R without the five best trades. The same rule at the same minute on random other days of the same year loses −0.070 R (t −3.25), a gap of +0.188 R.
Against it speaks that it stands alone: the neighbouring bands bring +0.026 and +0.053 R, the S&P 500 and Dow at ±1 EM +0.017 and +0.022 R. It is the best of 360 rows, picked after the fact, so only an observation.
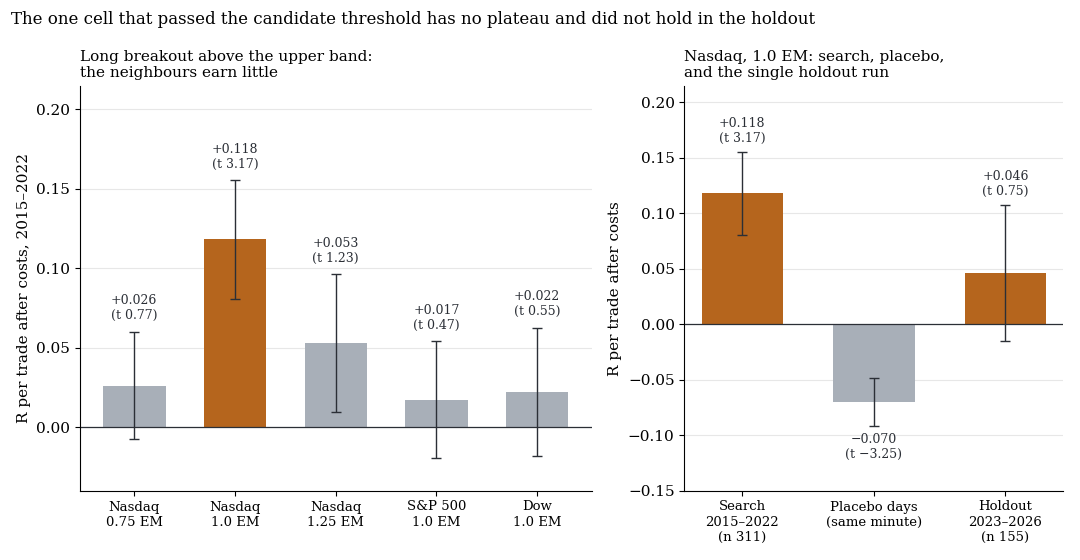
Left: the neighbours of the rule. Right: search period, placebo days and holdout (error bars: one standard error).
The holdout ran once, with the rule locked in advance (4 January 2023 to 5 June 2026, 844 days): 155 trades, +0.046 R (standard error 0.061, t 0.75), +0.036 R at 1.5 times the costs, +0.015 R without the five best trades. The size criteria are met, the statistical one is not: after the global correction over all holdout tests q is 0.58. With 155 trades the result fits zero as well as a small effect. Across the programme that makes 59 rule holdouts, and still only two have passed: the FTSE event day in the closing auction and the RSI(2) dip on US index CFDs.
What it means
The expected move is a usable width measure, but not a forecast. It holds about 80% of closes because options price in more movement than the market delivers, and a random market without any directional information does the same. The band is no barrier: against it every rule loses after costs, with it the result sits at zero. None of this says anything about open-interest walls, which our data cannot test.
Limits
- Data. Dukascopy BID CFD instead of the cash index. VIX, VXN and VXD are 30-day values; tools using the ATM vol of a near expiry usually sit a little lower, with narrower bands. VIX1D exists only since May 2022. Containment and touch tests cover 2015–2022 only, the holdout one rule.
- Calculation. If stop and target fall in the same minute the stop counts. Costs: about 0.10 R at 0.25 EM, about 0.05 R at 0.5 EM. Standard errors are clustered by date because the three US indices move almost alike.
- Selection. The candidate rule is the best of 360 rows, and placebo days have a different day shape than breakout days.
- Not tested: open-interest walls, the expected move from an ATM straddle, single stocks, futures.
All pattern families of the scan in the overview. Related: VIX curve, VVIX and dealer gamma and dealer gamma in practice.
📄 Full study as PDF: 7 pages incl. all tables, figures and limits (in German).
Disclaimer: Historical statistics are no guarantee of future market behaviour. This study is not investment advice. Trading carries a risk of loss up to total loss.