Data basis: Bitcoin (BTCUSDT) from the public Binance archive: minute candles, order book depth in bands up to ±5%, open interest, long/short ratios, funding rates and real liquidations (COIN-M), plus USD-M liquidations from Tardis on 82 single days. Search period / holdout (untouched, one run per test): weekend 2017–2022 / 12/2022–09/2026, order book 01/2023–06/2025 / 07/2025–09/2026, real liquidations 06/2023–05/2024 / 05–10/2024, liquidation map, funding, long/short 2020–09/2024 / 10/2024–09/2026. Costs: 10 basis points (bps, 1 bp = 0.01%) per round trip plus overnight financing of the Pepperstone CFD, sensitivity 2.5 bps. Benchmarks: mirror side, placebo times, random levels, shifted open interest, random market. No trading recommendation.
Bitcoin trades around the clock, weekends included. Three popular claims follow. First: the weekend move is retraced by Friday. Second: the order book reveals the next minutes, through an imbalance on one side or through large walls that pull price in. Third: liquidation levels, real and estimated, act as a magnet or turning point.
We tested all three with rules fixed in advance (13 primary tests, one holdout run each). The t-value shows how far a result lies above the noise; from 2 on it counts as notable. Up front: nothing holds after costs, and two signals that looked strong in 2020–2024 vanished in the holdout.
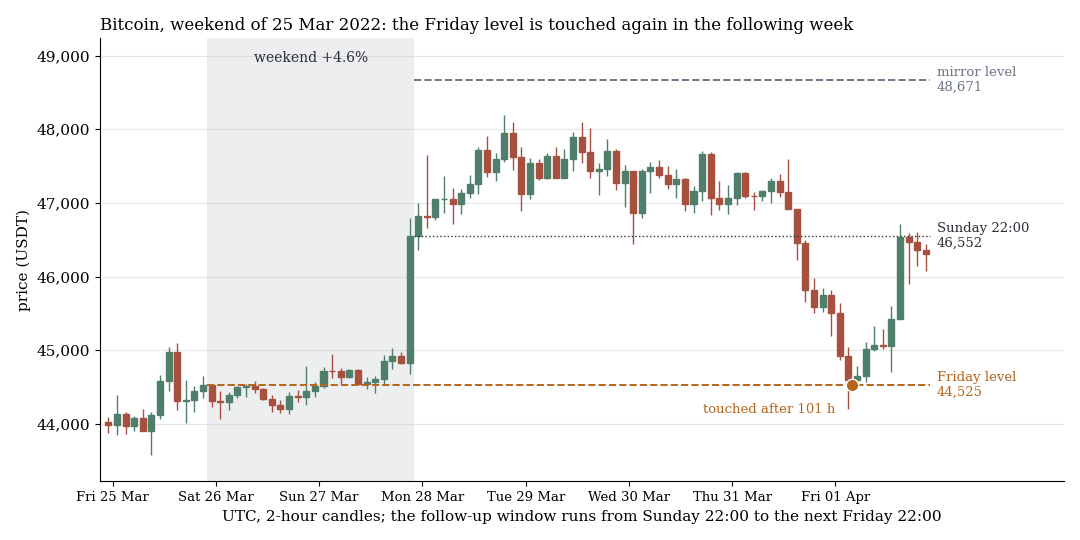
Weekend grey (Friday 22:00 to Sunday 22:00 UTC), mirror level at the same distance beyond the Sunday price. Both examples were drawn at random (fixed seed 7), not picked, from the 93 search-period weekends with a larger move, this one from the 55 with a touch: 25 March 2022, +4.6%, touched after 101 hours.
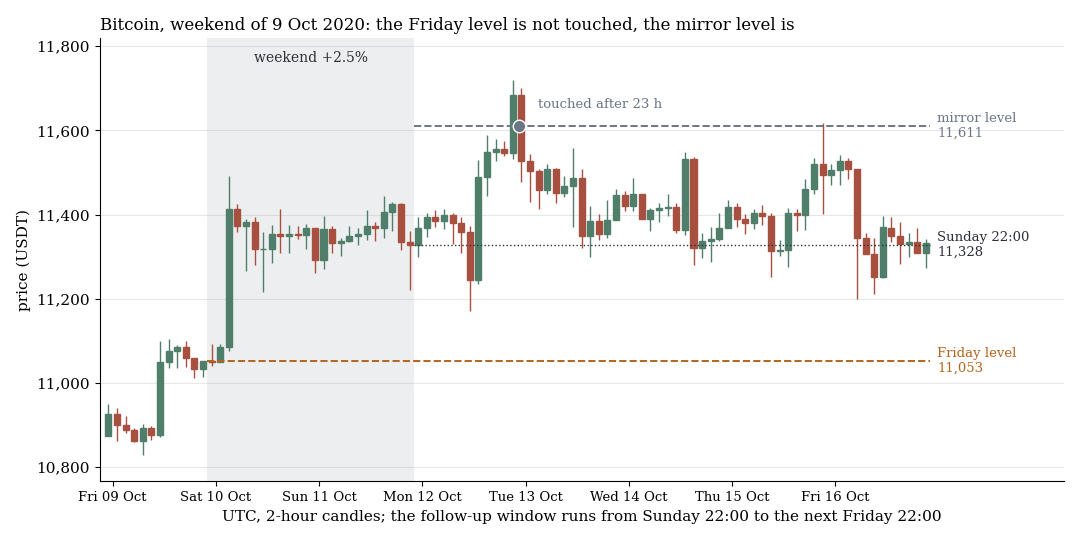
Counterexample from the 38 without a touch: 9 October 2020, +2.5%, mirror level reached after 23 hours.
1. Weekend: the Friday level is touched as often as its mirror image
If price touches the Friday level (the price at Friday 22:00 UTC) again within five days after the weekend, that looks like a retracement. But Bitcoin moves far more in a week than over a weekend, so we need a control, the mirror level. If the market really runs back, the Friday level must be hit more often. It is not: 74.7% against 74.3% across 261 weekends of 10 bps or more (t 0.1). For the 93 larger moves (at least half a typical 48-hour swing): 59.1% against 52.7% (t 0.7), in the holdout 64.6% against 70.8% for 48 (t −0.5).
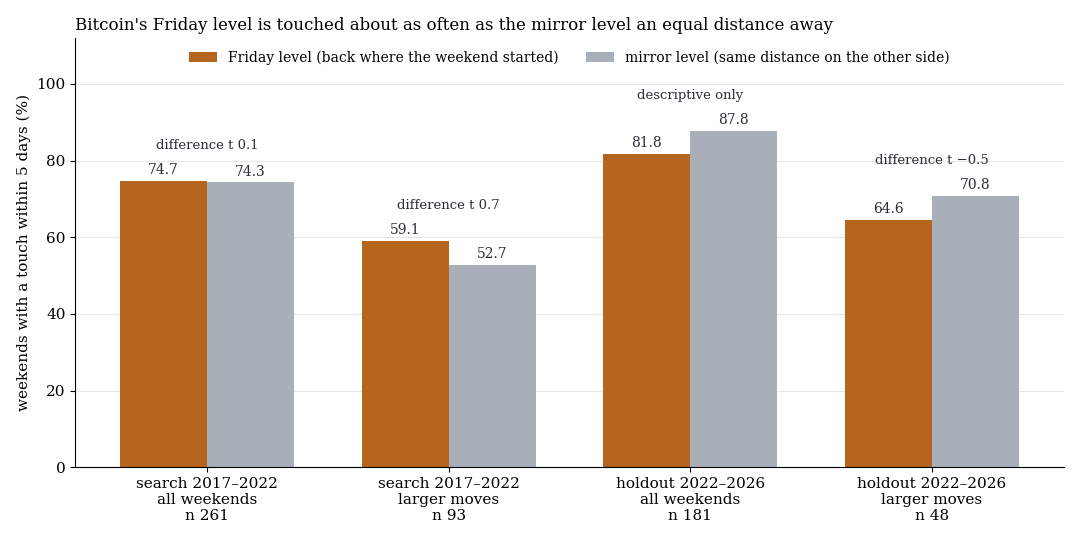
Share of weekends with a touch within five days, with the t-value of the difference above.
Nor does the retracement work as a trade: against the weekend move (entry Sunday 22:01, exit Friday 22:00) it makes −19.9 bps per week net (all weekends, t −0.3), in the holdout −143 bps (larger moves, t −1.3). Friday does not run ahead of the weekend either: slope 0.02 (t 0.2), holdout 0.04 (t 0.7). Only after the 30 largest weekend moves did the next week tend to continue (+669 bps, t 2.8; 17 holdout weeks +238 bps, t 1.1): spotted after the fact, not a rule.
2. Order book: the imbalance is measurable, but smaller than the spread
We compare bid and ask depth in bands from ±1 to ±5% around the price, fixed in advance: more bid, so long. In the search period price rises by 0.07 to 0.24 bps per standard deviation of bid excess over the next 5 to 15 minutes (t up to 3.3): real and tiny. In the ±5% band the trade (entry from 1.5 standard deviations) makes +2.8 bps gross (t 3.2) and −7.2 bps net over 60 minutes, and +5.4 bps gross (t 2.2) and −4.8 bps net over 240 minutes. In the holdout (±1% band) the slope is 0.10 bps (t 0.9), the trade −10.0 bps net (0.0 gross, 3,009 trades).
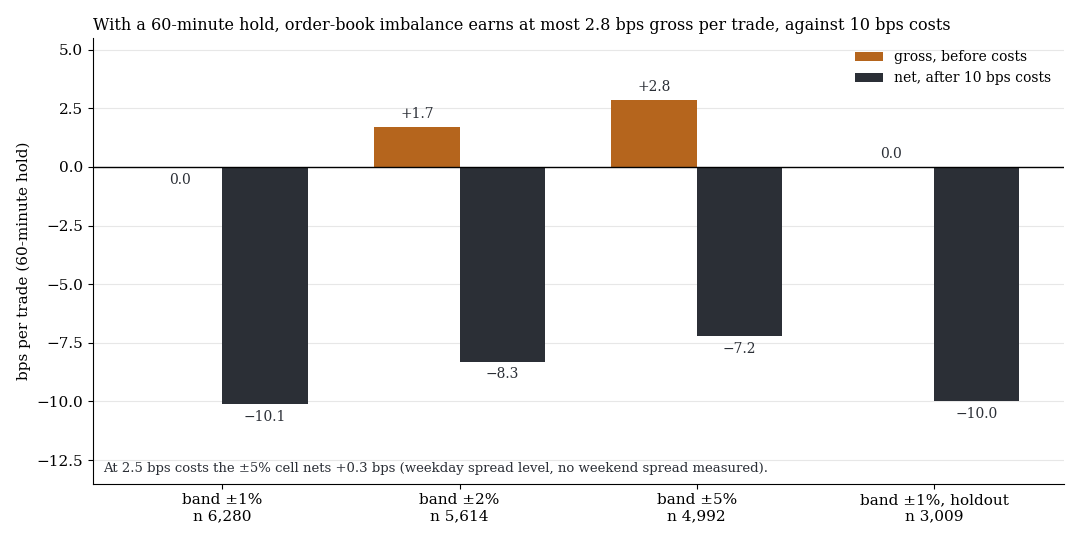
Result per trade with a 60-minute hold, orange before costs, dark after 10 bps.
Walls are excesses of depth in one band. If a wall pulls price in, price reaches it first more often than the equally distant level on the other side. It was 38.2% against 40.9% (t −0.5), in the holdout 37.0% against 36.1% (t 0.2). The bounce off a wall is noise (60 minutes: +7.8 bps gross, the control shifted by seven days +9.1 bps), and walls do not vanish more often on approach than on retreat (remaining depth 0.76 against 0.80, t −0.8). Spoofing is not demonstrated.
3. Liquidation levels: the map only knows the price path
Real liquidations: in the COIN-M contract a cluster is a five-minute sum above the 99th percentile of the previous 30 days. The reversal fixed in advance (buy after liquidated longs, sell after liquidated shorts) gives −1.3 bps gross and −11.4 bps net after 60 minutes (1,005 trades, t −5.0), with no excess over equally large moves without a cluster (−4.6 bps, t −1.1, 375 cases). In the holdout: −14.7 bps net (521 trades, t −4.4) and −9.0 bps excess (t −1.0).
Estimated map in the style of heatmap vendors: each increase in open interest is spread over the liquidation prices for 10x to 100x leverage, and touched levels disappear. Does price reach the denser cluster (at least 1.5 times the mass, within ±5%) first, within 72 hours? It does in 57.2% of 2,880 cases, a random walk would get 56.9% from the distances (+0.3 percentage points, t 0.15). After a dense cluster is touched, price does not continue (−15.1 bps net over 60 minutes, t −2.7). In the holdout the magnet shows +4.1 percentage points (t 1.3), random levels +1.0, the cascade −0.5 bps. A random market already tilts this statistic by 2 to 3 percentage points, so the +4.1 is no finding.
The decisive check compares, per five-minute bar, the mass the map books as hit with the real liquidations of the same side. With open interest from another half year it hits just as well. Its information is the price path, not the positioning.
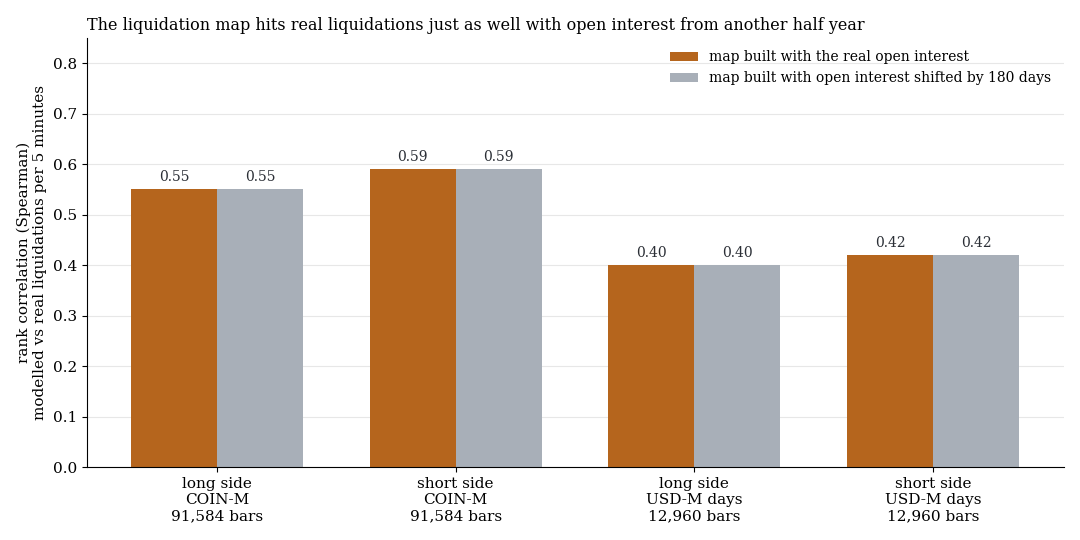
Rank correlation (Spearman) with real liquidations, map with real (orange) and 180-day-shifted open interest (grey).
4. Side finding: two strong signals vanish in the holdout
Two cells of the search passed the pre-set candidate threshold. Funding low: funding rate (the payment between longs and shorts) in the lowest twentieth of the last 270 settlements, then long for 72 hours. Account ratio: long/short ratio of all accounts at least two standard deviations from its 7-day mean, then traded against the crowd for 24 hours.
| Signal | Search period 2020–2024 | Holdout 10/2024–09/2026 |
|---|---|---|
| Funding low, 72 h | 103 trades, +209 bps net (t 3.8) | 54 trades, −41 bps (t −0.8) |
| Account ratio, 24 h | 459 trades, +63 bps net (t 3.7) | 198 trades, −2 bps (t −0.1) |
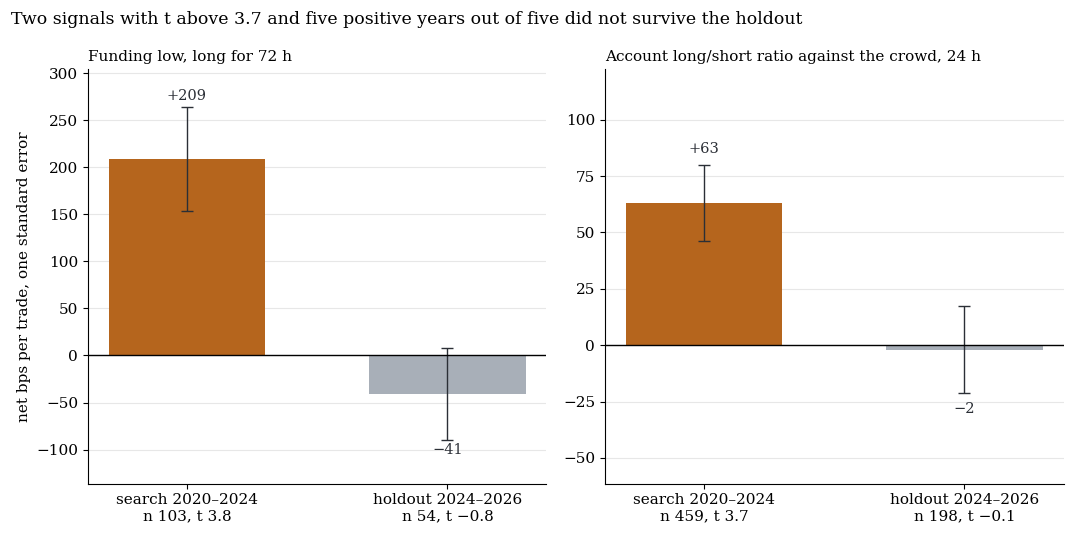
Net per trade, one standard error (mean divided by t).
Both signals passed the search's multiple-testing correction (q below 0.01) and beat the drift. In the holdout nothing is left. A regime change with ETF and CME trading from 2024 is the obvious but unproven explanation. The lesson: t 3.8 and five of five years positive are no proof.
What it means
None of the three claims holds after costs, and none of the 17 holdout runs was confirmed. In the global correction over all 59 holdout tests (as of 8 October 2026) only the FTSE auction rule and RSI(2) dip buying pass; the best Bitcoin line has q = 0.42. Liquidations can trigger cascades, but we find no edge beyond the price move itself.
Limits
- Data and costs. Binance prices, not the broker's feed. We did not measure the weekend spread; 10 bps is conservative (demo ticks, New York morning: 1.4 to 2.4 bps since August 2025). At 2.5 bps the ±5% order book cells would reach +0.3 bps (60 minutes) and +2.7 bps (240 minutes), without holdout run or slippage.
- Samples. With about 270 and 181 weekends, effects below about 40 bps per week cannot be shown; cells with 30 and 17 weeks are anecdotes. The liquidation holdout (five months) and the signal holdouts (two years) are short: “discarded” means not confirmed, not refuted. The signals were picked data-driven from 12 and 24 cells.
- Order book and liquidations. The archive has bands only, no single orders. COIN-M is the smaller market, and the stream records at most one liquidation per second (cascades under-recorded). The map is only one of many constructions.
- Not tested: second-by-second order flow, single orders, commercial maps, other exchanges, options.
All pattern families of the scan in the overview. Related: fixings and settlement dates.
📄 Full study as PDF: 9 pages incl. all tables, figures and limits (in German).
Disclaimer: Historical statistics are no guarantee of future market behaviour. This study is not investment advice. Trading carries a risk of loss up to total loss.