Data basis: Gold (XAUUSD) and Bitcoin (BTCUSD) around the US releases at 08:30 New York time. Minute data (Dukascopy CFD): gold 2015–2022 and Bitcoin May 2017–2022 as the search period, holdout (untouched period, one run, for the breakout rule only) 2023 to 5 June 2026. Real ticks (Pepperstone demo feed) from 3 April 2023 to 29 September 2026, tick search period to December 2024. Costs: minute calculation 0.40 USD (gold) or 10 bps (basis points, 1 bp = 0.01%) for Bitcoin, ticks with the real bid/ask spread, gold plus 0.07 USD commission per ounce. Benchmarks: random markets (every minute candle mirrored at its open with probability ½), days without a release, placebo time 09:30. No trading recommendation.
At 08:30 New York time the most important US figures come out, such as the jobs report (NFP) and consumer prices (CPI). Gold then jumps by several dollars within seconds. The common claim: whoever is fast enough catches the first move.
We tested three ways, each in gold and Bitcoin: the breakout from the 15-minute candle that ends with the release (a rule from our own rulebook, entry by market order), following the first seconds after the release, and a straddle (a buy stop and a sell stop before the release). What decides it is the fill, the price at which an order is actually executed. The test was fixed on 30 September 2026, before the first result.
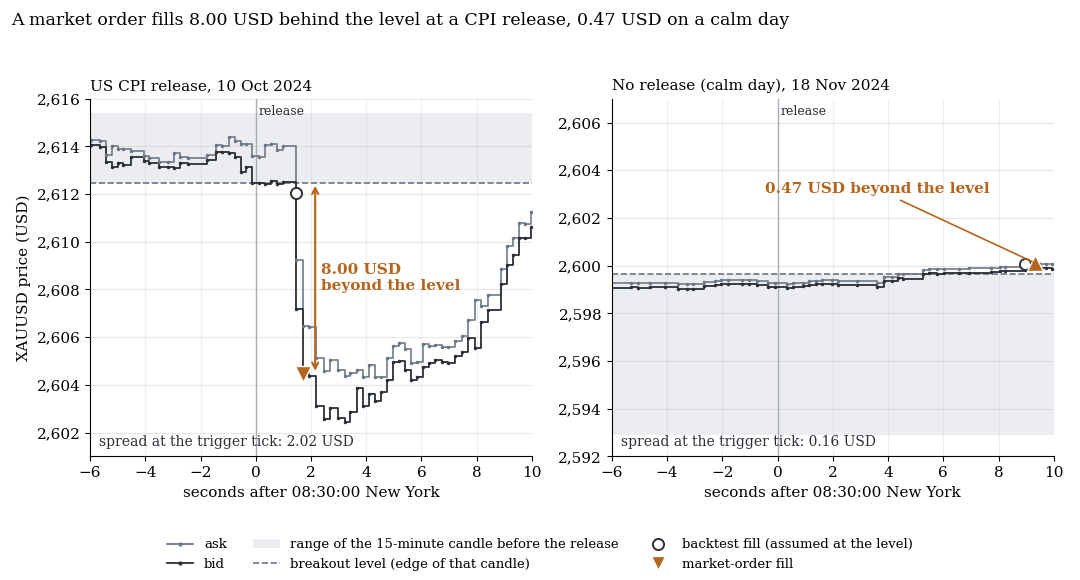
Gold, bid and ask at 08:30:00 New York time. Both days drawn at random with a fixed seed, not picked (from 26 NFP/CPI days and 164 calm days with an entry). Circle: fill of the minute calculation. Triangle: market order with 100 ms latency, 8.00 USD beyond the level on the CPI day at a 2.02 USD spread, 0.47 USD on the calm day. The CPI day lies above the mean (4.20 USD).
1. The minute backtest “earns” on NFP and CPI, and so does the random market
We split the days by the US release at 08:30: NFP and CPI, other news days (PPI, retail sales, the first GDP estimate, PCE) and calm days without a release. Days with minor releases are left out. R is the multiple of the initial risk per trade (distance from entry to stop). All values are net of costs.
| Gold, search period 2015–2022 | Trades | Minute backtest | Random market | Difference (t) |
|---|---|---|---|---|
| NFP and CPI | 118 | +0.40 R (t 2.5) | +0.47 R | −0.08 R (−0.4) |
| other news days | 209 | −0.11 R (t −1.8) | 0.00 R | −0.11 R (−1.3) |
| calm days | 681 | −0.09 R (t −2.4) | −0.11 R | +0.02 R (+0.4) |
On NFP and CPI days the rule looks good: +0.54 R gross against 0.14 R of costs. A random market with the same candles but no direction (mean of two draws) books +0.47 R.
The calculation fills at the level in the minute the level breaks. In that minute the price jumps through the level by several dollars, and the calculation books the jump as profit, in whichever direction. The random market keeps the candles and destroys only the direction. That it earns the same shows: the profit arises in the calculation, not in the market.
2. Real ticks: the market order fills dollars behind the level
On bid/ask ticks we replayed the entry: first tick after the release that breaks the level, fill with 100 ms latency at the ask (long) or bid (short).
| Days | Entries | Spread at the trigger (median) | Fill beyond the level (mean) | in R | Calculation books |
|---|---|---|---|---|---|
| NFP and CPI | 26 | 2.00 USD | 4.20 USD | 0.50 R | 0.14 R |
| calm days | 164 | 0.14 USD | 0.35 USD | 0.09 R | 0.11 R |
On NFP and CPI days the entry costs 0.50 R instead of 0.14 R, an extra +0.37 R per trade (t 10.0). Shorter latency hardly helps: from 0 to 250 ms the fill lies 3.9 to 4.5 USD behind the level. A single real order on 30 September 2026 (a PCE and GDP day) served as a measurement point: executed 85 ms after the signal, 1.21 USD worse than the price at sending, against a model median of 0.04 USD slippage (deviation from the signal price) on such days.
The whole rule also ran in the MetaTrader 5 strategy tester on real ticks (April 2023 to September 2026, 687 trades). On NFP/CPI: +0.27 R (t 1.1, 49 trades), median 0.00 R, −0.17 R without the five best days. News days minus calm days: −0.04 R (t −0.27), all days −0.01 R. Over the common period to June 2026 the minute calculation overstates the NFP/CPI days: +1.09 R against +0.44 R (36 days, t −2.1).
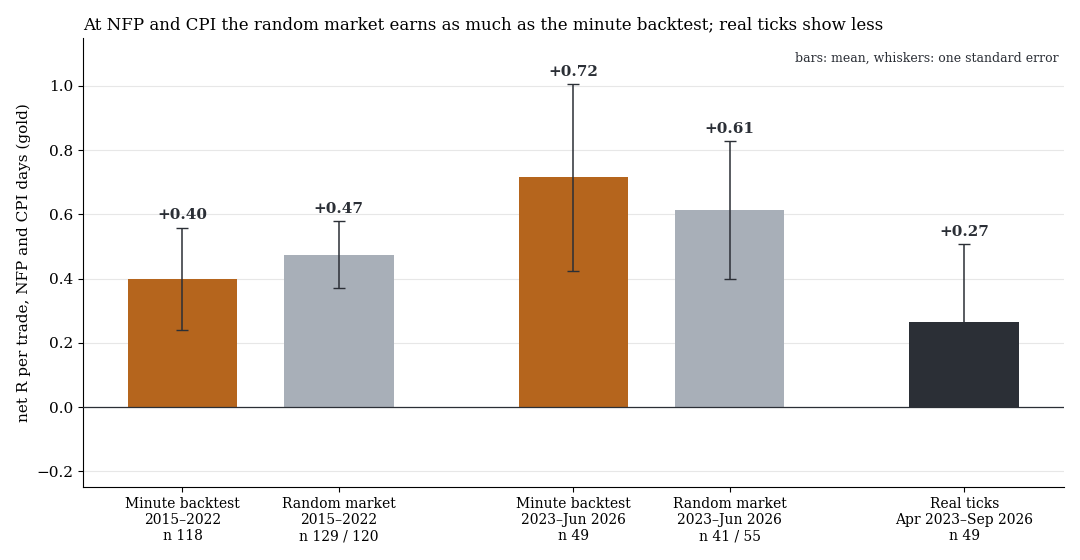
Net R per trade on NFP/CPI days: minute backtest (orange), random market (grey) and tester on real ticks (dark). The 2023 to June 2026 holdout shows the same picture.
3. The straddle on minute data is the clearest example
Gold, news days, 15-minute holding period, 368 trades 2015–2022: +9.92 bps net (t 5.9). Two random markets deliver +9.47 and +10.13 bps, and on real ticks (99 trades) −4.32 bps remain. The same mechanism: the calculation fills the stop at the level, a real stop fills after the jump.
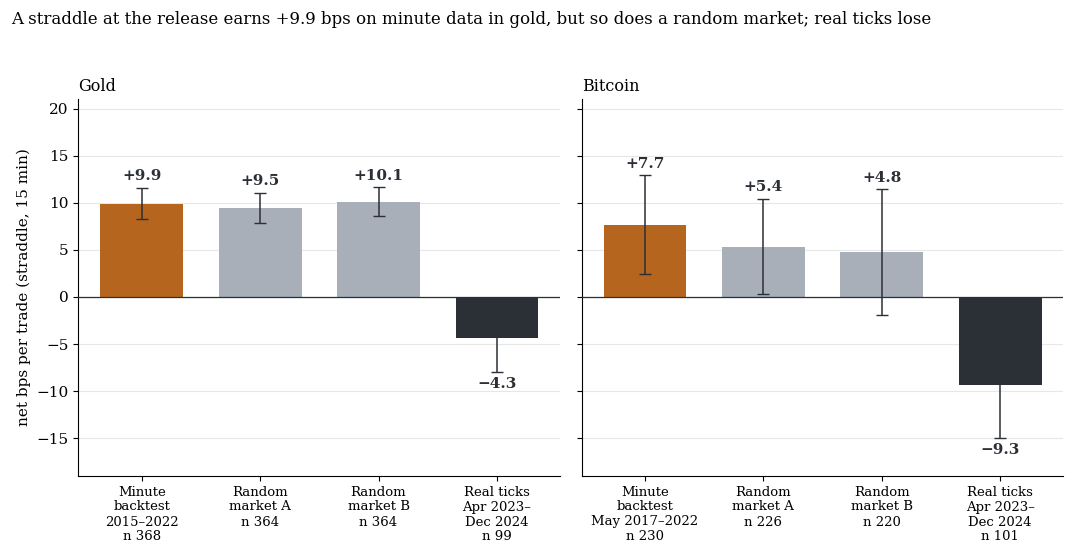
Net bps per trade, news days, 15-minute holding period, with one standard error. Minute data 2015–2022 (Bitcoin from May 2017), ticks April 2023 to December 2024.
4. Trading the first seconds: negative even before costs
Following the first move: direction from the mid price (midpoint of bid and ask) 5 seconds after the release against one second before it, entry 100 ms later. Straddle: a buy stop and a sell stop one typical minute range away from the price before the release, the first one triggered counts. Holding period 15 minutes, gross means mid to mid without spread and commission.
| Market, rule | Trades | gross | net | t (net) |
|---|---|---|---|---|
| Gold, follow the first move | 104 | −1.39 bps | −3.66 bps | −1.2 |
| Gold, straddle | 99 | −1.80 bps | −4.32 bps | −1.2 |
| Bitcoin, follow the first move | 104 | +5.64 bps | −1.61 bps | −0.3 |
| Bitcoin, straddle | 101 | −2.59 bps | −9.31 bps | −1.6 |
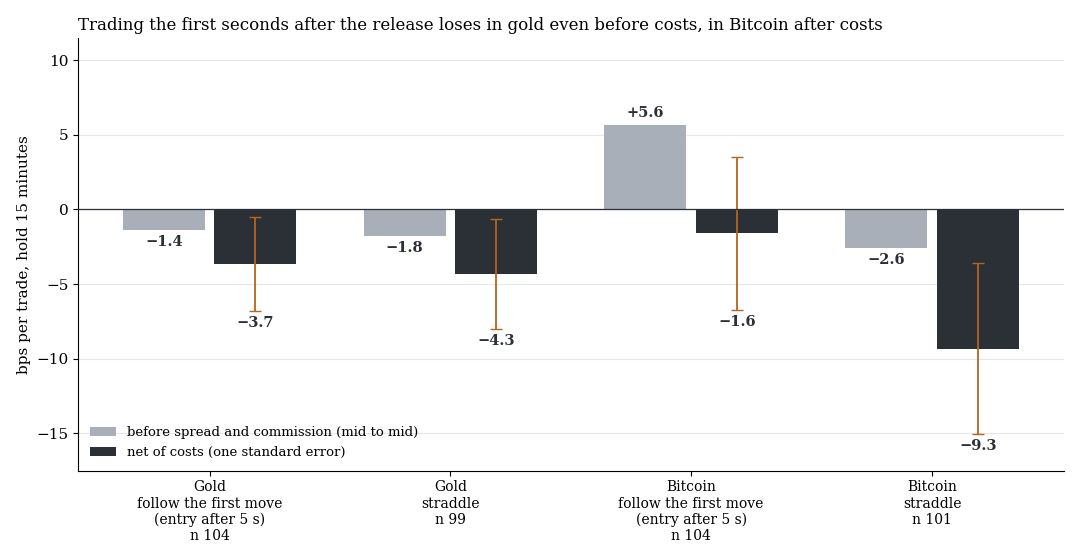
Result per trade in bps, grey before spread and commission, dark net. Pepperstone ticks, April 2023 to December 2024.
In gold both ways are negative even before costs. All 36 combinations of the first-move rule, from waiting time (1, 5, 30 s), holding period (5, 15, 60 min) and latency (0 to 250 ms), lie at best at −3.4 bps net and −1.0 bps gross. Latency changes nothing (0 ms: −3.76 bps, 250 ms: −3.75 bps), and the straddle with a server-side stop sits at −3.74 bps. The best straddle cell reaches +1.49 bps gross and −1.91 bps net. For the first-move rule, calm days (−2.05 bps) and random markets (−4.44 and −2.93 bps) lie in the same range.
5. Bitcoin shows the same picture
In Bitcoin random markets (+5.4 and +4.8 bps) explain most of the minute straddle (+7.67 bps), and on ticks it stands at −9.31 bps. The breakout rule has no news advantage in 2017–2022 (news days minus calm days −0.03 R, t −0.4) and loses −0.30 R per trade over all days in the holdout (675 trades, t −8.2). On NFP/CPI the market order fills 94.7 USD behind the level, at a median spread of 52.5 USD: 0.35 R against 0.24 R in the calculation.
6. A side note on prop firm rules
According to FTMO’s FAQ (“Can I trade news?”, accessed 30 September 2026), on an FTMO Account (Funded, account type Standard) opening and closing trades on the affected instruments is prohibited from 2 minutes before to 2 minutes after a restricted release, including executed pending orders and triggered stop loss or take profit. Gold is affected, and NFP and CPI are restricted events. According to the FAQ, Challenge, Verification and Swing accounts are not restricted, and Bitcoin is not on the list. An entry in the second of the release lies inside the restricted window: in our test, 48 of 49 trades on NFP/CPI days had an entry or exit between 08:28 and 08:32. We did not check day by day which dates are restricted, and the current FAQ is what counts.
What it means
The minute backtest does not measure the market at NFP and CPI but the assumption of being filled at the level. Anyone building or buying a news strategy should demand bid/ask ticks with a fill after the jump, and the counter-check on a random market.
Of 1,796 hypothesis tests, 238 survive the multiple-testing correction (Benjamini-Hochberg, q = 0.10), 23 of them positive. All 23 fail on the random market or are control and cost measurements, and there was no candidate. Low latency improves the fill, not the information in the first seconds. Other approaches stay open, these three simple ways do not.
Limits
- Demo feed. The ticks arrive at 08:30 only every 100 to 200 ms. Latencies below about 200 ms cannot be resolved, and an algorithm acting in the first milliseconds is not represented. The one real order shows more slippage than the model, so real results are more likely worse.
- Small samples. The second-level rules rest on 21 months (about 100 news days each), standard error about 3 bps (gold) and 5 bps (Bitcoin), and effects below 6 to 10 bps are not excluded. Bitcoin second data for 2017–2022 were not evaluated.
- Method. The random market assumes the artefact acts equally in both markets. The tester fills at the tick price plus a fixed delay, without a queue, for gold only.
- Not tested: the direction of the surprise (actual against forecast), FOMC at 14:00, an entry only after 08:32, other instruments.
All pattern families of the scan in the overview. Related: FOMC, NFP, CPI and ECB intraday, reference candles on FX and gold, do trend days need a catalyst?.
📄 Full study as PDF: 9 pages incl. all tables, figures and limits (in German).
Disclaimer: Historical statistics are no guarantee of future market behaviour. This study is not investment advice. Trading carries a risk of loss up to total loss.