Data basis: Part A: DAX, Nasdaq 100, S&P 500 and Dow, Dukascopy CFD minute data, cash session, search period 2015–2022, 2,036 trading days, sample time every 30 minutes. Benchmarks: a level at the same distance on the other side and two random markets. The holdout from 2023 stayed untouched because the gate was missed. Costs per round trip as in every study of this series. Part B (descriptive): order book of the E-mini S&P 500 future on 40 days from January 2023 to September 2026, the same data as in our order book study. Pre-registered on 16 November 2026 (SHA-256 b1fb4d68…). No trading recommendation.
Above prominent highs and below prominent lows sit stop orders. A whole school of thought has grown from this: the price is said to be attracted by this liquidity, large participants are said to let it run there on purpose to fill their orders, and to turn it afterwards. Our earlier measurements on this tested single trading rules: the channel break toward the liquidity side and the smart money patterns. Here we measure the claim itself. If stop zones attract, they have to be reached more often than a level at the same distance where no stops sit.
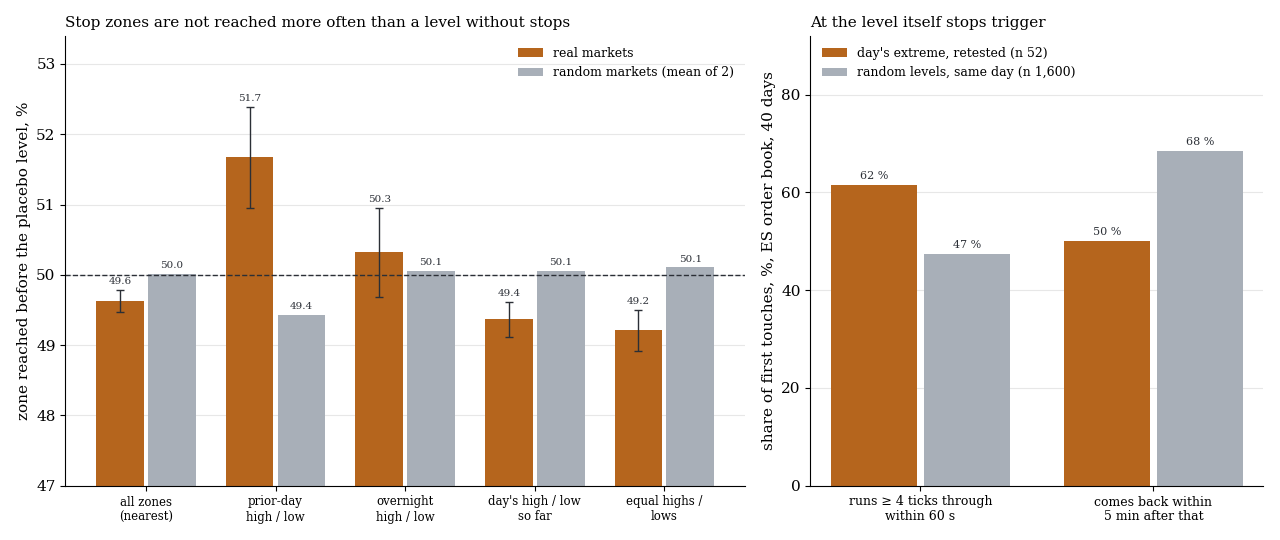
Left the share of races in which the zone is reached before the placebo level, real with one standard error and as the mean of two random markets. Right from the order book: how often the price runs through at a retested extreme of the day and how often it comes back afterwards, against random levels of the same day.
1. The race
| Building block | Definition |
|---|---|
| Zone 1 | high and low of the prior day's cash session |
| Zone 2 | high and low of the night, from the prior close to the cash open |
| Zone 3 | the day's high and low so far, from 30 minutes after the open |
| Zone 4 | equal highs or lows today: two confirmed turning points at most 0.05 daily ATR apart, not exceeded since |
| Condition | the zone has been untouched since it formed and lies 0.10 to 1.00 daily ATR from the price |
| Placebo | a level at the same distance on the other side |
| Outcome | which of the two levels is touched first by the end of the session |
All zones are known at the sample time. On a random walk each side wins half of the races because both levels are equally far away. A magnet would have to lift this rate above 50 %. Read as a trading rule, the race is a trade toward the zone with the placebo as the stop.
The gate: a rate above 50 % with t ≥ 3, at least two standard errors above both random markets, and a positive result after costs.
2. Result: no magnet
| Zone | n races | zone first | t against 50 % | random market 1 / 2 | net per trade |
|---|---|---|---|---|---|
| all, the nearest each time | 110,440 | 49.6 % | −2.3 | 49.8 % / 50.2 % | −0.130 R |
| Prior-day high and low | 22,330 | 51.7 % | 2.3 | 49.7 % / 49.2 % | −0.037 R |
| Overnight high and low | 29,802 | 50.3 % | 0.5 | 50.3 % / 49.8 % | −0.072 R |
| Day's high and low so far | 77,875 | 49.4 % | −2.5 | 49.8 % / 50.4 % | −0.118 R |
| Equal highs and lows | 49,462 | 49.2 % | −2.7 | 49.8 % / 50.4 % | −0.153 R |
Decided races, 2015–2022, standard errors clustered by day. A quarter of all races stayed undecided until the end of the session and does not count.
The stop zone is not reached more often than the level without stops, but marginally less often. The distance to the random markets is −0.9 and −2.5 standard errors, so also in the wrong direction. This holds for zones above and below the price (49.0 % and 50.2 %), for near and far zones, and for each of the four markets (49.4 to 49.9 %).
Precisely the zones regarded as the strongest magnets in that school of thought are below 50 %: the day's extreme and equal highs or lows. The only cell above 50 % is the prior-day high and low at 51.7 %. It is one of several sub-cells, picked out afterwards, and stays at −0.037 R per trade after costs.
3. What happens at the level itself
Price data does not show what sits in the book. Hence the second look, into the order book of the ES future: what happens when the price reaches again an extreme of the day that had stood untouched for at least 30 minutes? The comparison is with randomly drawn levels of the same day under the same rules.
| First touch | n | depth before, relative to usual | runs ≥ 4 ticks through in 60 s | comes back within 5 min after that | move after 5 min |
|---|---|---|---|---|---|
| Day's extreme | 52 | 1.27 | 61.5 % | 50.0 % | −0.4 ticks |
| Random levels | 1,600 | 1.15 | 47.4 % | 68.4 % | −2.7 ticks |
| Difference on the same day | +0.12 (t 2.7) | +16 points (t 2.2) | −12 points (t −1.2) | +0.8 ticks (t 0.2) |
40 days, difference per day against the random levels of the same day, standard errors across days. Descriptive, without a gate.
At the level itself the stops are visible. Before an extreme of the day there is not less but more depth in the book than usual, and the price more often runs at least four ticks through. That fits triggered stop orders meeting waiting orders on the other side. After that nothing is left to see: the move of the next five minutes does not differ from that at a random level. At the overnight high and low (31 touches) there is no difference at all.
What this means
Two things are mixed up in the teaching about liquidity. One is true: orders sit at prominent levels, and when the price gets there they trigger. The other is not: the price is not pulled there, and after the run through neither continuation nor reversal follows reliably. A price target “the liquidity above the high” is as good as a target at the same distance in the other direction. In practice one small observation about execution remains: a stop directly behind the day's extreme is reached more often on a retest than at an arbitrary level.
Limits
- Stops are assumed. Where stops really sit, the data does not show. The zones are the levels where they are usually presumed.
- CFD prices in part A. The race runs on minute data of a CFD provider, not on exchange prices.
- Part B is small. 52 touches on 40 days, only in the ES future, descriptive. The depth is that of the ten best price levels on the side being approached.
- Only within the session. Multi-day levels such as weekly highs and zones from higher time frames are not tested.
- Holdout not run, because the gate was missed.
All pattern families and holdouts in the overview. Related: liquidity withdrawal on gold ticks.
📄 Full study as PDF: 6 pages incl. all tables, figures and limits (in German).
Disclaimer: Historical statistics are no guarantee of future market behaviour. This study is not investment advice. Trading carries a risk of loss up to total loss.