Data basis: Real ticks from a retail broker (demo account, bid and ask in milliseconds) for gold (XAUUSD), 07:55 to 12:05 New York, search period April 2023 to December 2024 with 452 trading days. The holdout 2025 to September 2026 stayed untouched because no candidate passed the gate. Costs: real spread at entry and exit plus 0.07 USD commission per ounce. Benchmarks: for each event a random second on the same day in the same time window, and two tick surrogates with a random sign for every one-second move and the spread unchanged. Pre-registered on 10 November 2026 before any calculation (SHA-256 eba3d857…). No trading recommendation.
The question from trading was: when do market makers pull their liquidity, when do takers run, and can this be seen without an order book? The thought behind it is that the state of the order book shows up in the tick stream: the spread widens, the price jumps unusually far, or suddenly no ticks arrive.
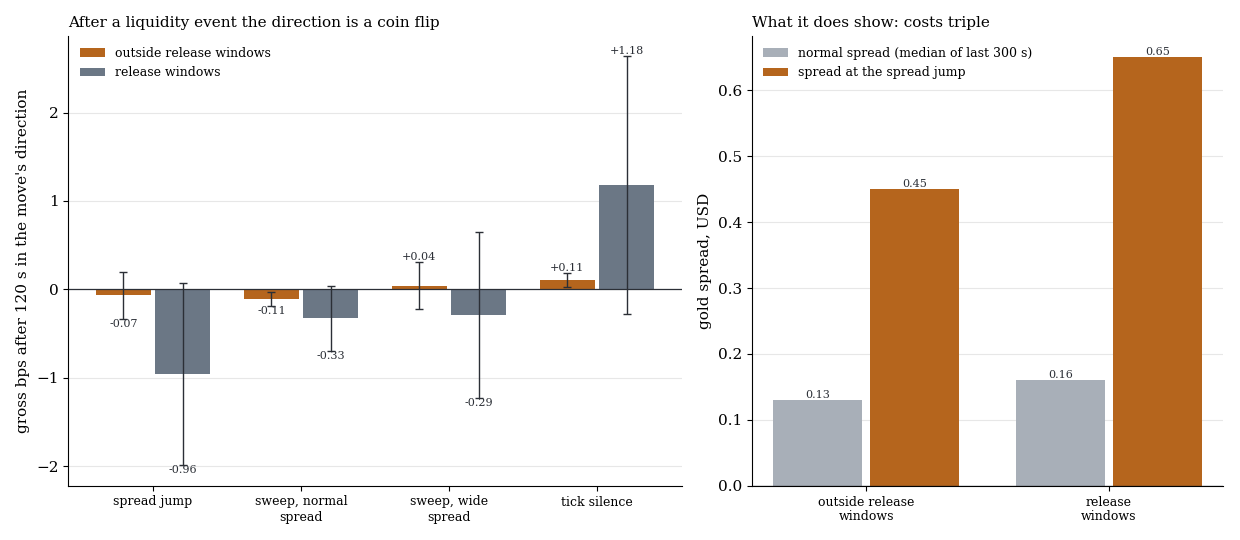
Left the move 120 seconds after the event in the direction of the preceding move, gross in bps with one standard error, outside and inside the release windows. Right the spread during the spread jump against the normal spread of the five minutes before.
1. Detector and trade
Everything on a one-second grid, measured against the median of the prior 300 seconds.
| Event | Condition |
|---|---|
| E1 spread jump (primary) | largest spread at least three times the base and at least 0.15 USD above it |
| E2 sweep with normal spread | move over 2 seconds at least eight times the usual and at least 0.50 USD |
| E3 sweep with wide spread | the same move, spread at least twice as wide |
| E4 tick silence | otherwise at least 3 ticks per second, now 3 seconds without a tick |
Split into release windows (around 08:30, 09:30 and 10:00 New York) and the rest. Entry 100 milliseconds after the event, exit after 30, 120 or 600 seconds, following the direction of the last 5 seconds or against it. 24 cells, primary E1 outside the release windows after 120 seconds.
2. Result: no candidate
| Event (120 s) | Window | n | gross bps (t) | net follow | net against | vs. random second Welch t |
|---|---|---|---|---|---|---|
| E1 spread jump | rest | 1,143 | −0.07 (−0.26) | −1.16 | −1.03 | −0.39 |
| E1 spread jump | release | 317 | −0.96 (−0.93) | −3.00 | −1.08 | −0.72 |
| E2 sweep, normal spread | rest | 7,456 | −0.11 (−1.45) | −1.14 | −0.93 | −0.92 |
| E3 sweep, wide spread | rest | 1,085 | +0.04 (0.15) | −1.11 | −1.19 | −0.47 |
| E4 tick silence | rest | 3,191 | +0.11 (1.39) | −0.90 | −1.11 | 1.62 |
Search period April 2023 to December 2024, net in bps after spread and commission. Over all 24 cells gross |t| ≤ 2.02 and q ≥ 0.64.
After a liquidity event the direction is a coin flip. Following and fading both lose roughly the spread plus commission net, more in the release windows. The random second and the surrogates do not differ. The only cell with gross t above 2 (tick silence in the release window after 30 seconds, n 76) has q 0.64; traded against, it loses −2.87 bps net.
3. What the detector does show
| Spread jump | per day | spread in the event | normal spread | back to normal after (median / 90 %) |
|---|---|---|---|---|
| outside release windows | 2.54 | 0.45 USD | 0.13 USD | 1 s / 13 s |
| release windows | 0.70 | 0.65 USD | 0.16 USD | 12 s / 39 s |
A market order in the middle of the event costs three to four times the normal spread. Waiting a few seconds usually saves that. The detector is therefore useful as protection against bad fills (a relative spread guard instead of a fixed point limit), not as a signal.
What this means
A liquidity withdrawal is real and measurable, but it shows costs, not direction. This fits our news trading on the same ticks, where even the move around scheduled releases was negative after costs.
Limits
- Demo feed. Spread spikes may be smoothed on a demo account, ticks slightly delayed.
- Gold only and only 07:55 to 12:05 New York. Indices are untested because no ticks were available.
- Fixed latency of 100 milliseconds without a queue.
- Thresholds set once and not varied.
- Whether waiting saves more than it costs is not measured. That would need a test of its own with delayed entries.
All pattern families and holdouts in the overview.
📄 Full study as PDF: 5 pages incl. all tables, figures and limits (in German).
Disclaimer: Historical statistics are no guarantee of future market behaviour. This study is not investment advice. Trading carries a risk of loss up to total loss.