Data basis: Full-depth order book of the E-mini S&P 500 future (ES), every single order with add, modify, cancel and execution (Databento, dataset GLBX.MDP3, market-by-order format). 40 sample days from January 2023 to September 2026, always the most traded contract, evaluated in the cash session 09:30 to 16:00 New York. The book was rebuilt order by order each day from the morning snapshot and put on a one-second grid: 931,160 seconds. The data cost about 45 USD. Measurements, split and gate were fixed before the first calculation (registered on 13 November 2026, SHA-256 9a67f65b…). The search ran on the 20 days with an even index, the confirmation on the other 20. Costs: 1 tick round trip for the future, 3.2 ticks for an index CFD. Not a trading recommendation.
The question from trading was: how do market makers act? When do they assume that the other side knows more and let the price run? When do they lean against it? And what does their hedging in the index do to the price? Minute data cannot answer this; one has to see which orders sit in the book and which disappear. Because this data costs money, we publish the results in full so that others do not have to buy it again.
Terms such as order book, market maker or market taker are explained in the foundations series: the order book in chapter 2 and liquidity in chapter 3.
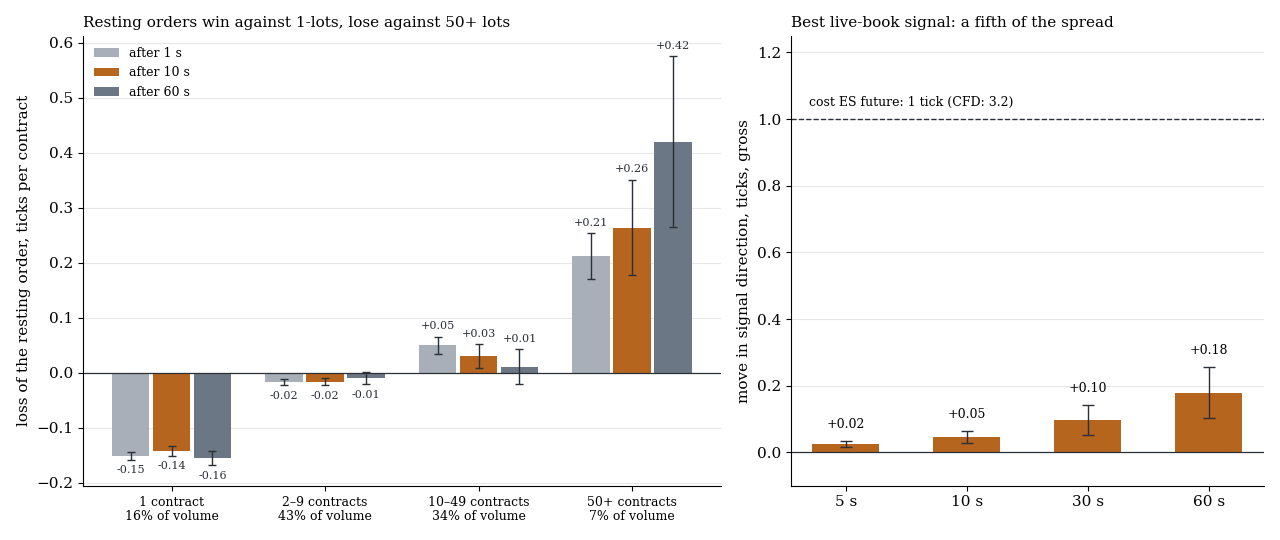
Left: the loss of the resting order per contract by size of the executing market order, 1, 10 and 60 seconds after the trade, mean over 40 days with one standard error. Negative means the resting order wins. Right: the move after the strongest book signal (imbalance of the ten best price levels), gross in ticks, against the cost of the future.
1. Data and rebuild
A "market maker" here is any resting order, that is, whoever provides liquidity. The data carries no names; what is measured is behaviour. A trade has two sides: the market order that executes (the aggressor) and the resting order that is hit.
The rebuild was checked on all 40 days: no second with a crossed or empty book, the spread was one tick in 97 % of seconds, cash-session volume was 0.66 to 2.17 million contracts a day, and the gap between future and index matched the time to expiry.
One deviation from the plan: on two days of the roll week (14 March 2023 and 17 March 2025) the provider's symbol mapping still returned the expiring contract. Both days were reloaded with the new contract.
2. Three pre-registered measurements
- M1 retreat. Do market makers pull depth after losing to informed traders? Measured is the loss of resting orders per minute (price 10 seconds after execution) as a deviation from the 30 minutes before, then depth, range and cancellations over the next 5 minutes.
- M2 hedging. Does dealer gamma dampen the move in the future? Per day the autocorrelation of 5-minute returns and the flow response to price moves, against gamma from open interest and a freely published gamma series.
- M3 lean or let run. What happens after a one-sided rush of market orders? Minutes with flow above the 95 % value of the hour before, then the move in flow direction over 1, 5 and 15 minutes.
The gate was strict: an effect from one minute on with |t| ≥ 3 in the search half and |t| ≥ 2 with the same sign in the confirmation half, a time placebo (one day's signal against the next day at the same clock time) with |t| < 2, and for M3 more than one tick net. M2 was fixed as descriptive because there are only 40 days.
3. Result: gate not passed
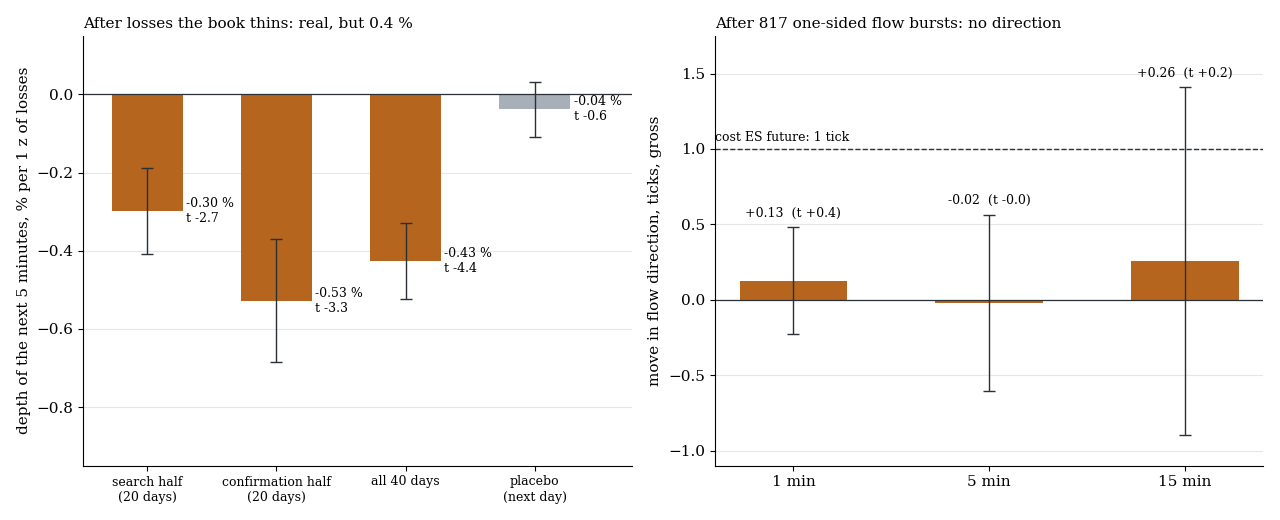
Left: change in depth over the 5 minutes after a minute with high losses for resting orders, per standard deviation of the losses, with one standard error (clustered by day). Right: move in flow direction after 817 one-sided flow bursts, gross in ticks.
| Measurement | Search half | Confirmation | All 40 days | Placebo |
|---|---|---|---|---|
| M1 depth after losses, per 1 standard deviation | −0.30 % (t −2.7) | −0.53 % (t −3.3) | −0.43 % (t −4.4) | −0.04 % (t −0.6) |
| M1 range afterwards | t 0.2 | t 1.3 | t 1.1 | t 0.9 |
| M1 cancellations against new orders | t −1.4 | t 0.7 | t −0.7 | t −0.3 |
| M3 move in flow direction after 1 / 5 / 15 min | +0.13 / −0.02 / +0.26 ticks (t 0.4 / 0.0 / 0.2) |
The retreat is real: after a minute with unusually high losses there is less depth in the book over the next five minutes, in both halves, and the placebo is zero. But it is tiny, 0.43 % less depth per standard deviation, and the search half misses the threshold (t −2.7 instead of −3). The range afterwards does not become measurably larger.
After a one-sided flow burst the direction is a coin flip. That holds also when the 817 minutes are split by whether the price absorbed the flow (441 times, "absorption") or ran with it (256 times, "run"), and by whether the market makers had lost before. Of 27 cells none reaches |t| ≥ 3 in the search half; the largest is 1.8. Choosing the direction after the fact, 6 cells keep something after one tick of costs, but none of them is even close to robust (|t| ≤ 1.6 over all days).
4. What the book reveals about market makers
No trading rule, but instructive. These values are descriptive; the size table was added after the evaluation and was not pre-registered.
Who wins against whom. Splitting the trades by size of the market order shows what market makers protect themselves against:
| Size of the market order | Share of volume | Loss of the resting order after 1 s | after 10 s | after 60 s |
|---|---|---|---|---|
| 1 contract | 16 % | −0.15 ticks (t −20.6) | −0.14 | −0.16 |
| 2 to 9 | 43 % | −0.02 (t −3.0) | −0.02 | −0.01 |
| 10 to 49 | 34 % | +0.05 (t 3.1) | +0.03 | +0.01 |
| 50 and more | 7 % | +0.21 (t 5.1) | +0.26 (t 3.0) | +0.42 (t 2.7) |
| all | 100 % | 0.00 | −0.01 | 0.00 |
Negative: the resting order wins. Volume-weighted per day, mean over 40 days, t over days.
Against single contracts the resting orders earn, against orders of 50 contracts and more they lose, and the loss keeps growing for a minute. "Informed" can be recognised by order size here. In total the two almost exactly cancel out.
Gamma dampens. On days with a lot of dealer gamma, 5-minute moves tend to revert; on days with little, they tend to continue: the autocorrelation falls with gamma (rank correlation −0.34 with gamma from open interest, −0.35 with the published series, p 0.03; in the top gamma third −0.08, in the bottom +0.04). That fits the dealer hedging derived in chapter 8 of the foundations. With 40 days it is a direction, not a size.
Fear in the book. The higher the VIX, the thinner the book (rank correlation −0.68) and the further the same order quantity moves the price (+0.65).
5. After the fact: what would a live order book add?
After the negative gate came the question: and if one sees the book live? Measured was what a flawless live book shows at the end of each second, with entry one second later at the mid. That is cheaper than any real execution. The signal was always the extreme tenth. This part was not pre-registered.
| Signal | after 5 s | after 10 s | after 30 s | after 60 s |
|---|---|---|---|---|
| Imbalance of the ten best levels | +0.02 (t 2.8) | +0.05 (t 2.7) | +0.10 (t 2.1) | +0.18 (t 2.3) |
| Imbalance of the best level | +0.01 (t 2.4) | +0.01 (t 1.2) | −0.01 | +0.01 |
| Market-order flow, 5 s | −0.01 | −0.01 | +0.02 | −0.01 |
| New minus cancelled orders, 5 s | −0.01 | −0.01 | −0.01 | −0.03 |
Move in signal direction, gross in ticks, all 40 days, t over days. For the best signal the search half is only at t 0.8 to 1.6.
The best signal predicts 0.18 ticks over one minute. The future costs one tick, a CFD 3.2. On this time scale a live book delivers the same null result as the minute measurement. What happens below that, in milliseconds, we did not measure and could not trade.
6. After the fact: liquidity cascades
Second follow-up: do market makers sometimes let the price rush through for longer, or do they refill at once? An episode counts when the depth of the ten best levels falls below half its median of the preceding 30 minutes, until it is back at 80 %. This was not pre-registered either.
| Value | |
|---|---|
| Episodes in 40 days | 53, none on 15 days, 10 on one day |
| Duration | median 33 s, 75 % shorter than 88 s, 90 % shorter than 187 s |
| longer than 5 minutes | 4 episodes on 3 days |
| Share of session time | 0.6 % |
| Range inside the episode | about three times as large as otherwise |
Several episodes start at 09:59, one minute before data releases at 10:00 New York: market makers step back ahead of scheduled events. The longest lasted 909 seconds on 10 October 2025 from 10:57, with a move of 175 ticks.
None of this is tradable. Following the move 10 or 60 seconds after the start gives |t| < 1 after 1, 5 and 15 minutes, and the sign flips between the halves. When depth falls below a third, a reversal is hinted at rather (−14 ticks in 5 minutes for whoever follows, t −1.5, 24 cases); that is not robust. When only one side thins out, no direction follows.
7. What of it is tradable
- Direction: nothing. Neither after losses of the market makers nor after flow bursts, neither over minutes nor with a live book over seconds. This matches our liquidity withdrawal on gold ticks, where the withdrawal was visible as well and the direction afterwards a coin flip.
- Execution. In a retreat phase the book is thin and the range three times as large. A market order at exactly that moment is expensive, and most phases are over after half a minute to a minute and a half. Whether waiting saves more than it costs on average we did not measure.
- Size. Gamma and the VIX say something about how thick the book is and whether moves tend to revert. That is a measure of the size of a move, as in our study on VIX and gamma, not a directional signal.
- Large orders. Orders of 50 contracts and more carry information. Whoever trades large is treated accordingly by the market makers. A rule to follow large orders cannot be derived from it: their lead is fractions of a tick.
Limits
- 40 days. For M1 and M3 that is 14,600 minutes and 817 events; for everything measured per day (gamma) only 40 values.
- Anonymous data. Every resting order counts as a market maker, including a fund that simply places a limit.
- One-second grid. Reactions below one second are not measured. Entries are at the mid, not at an executable price; real results would be worse.
- Parts added after the fact. Size table, live book and cascades were added after the gate. They are descriptive and would have needed a gate of their own.
- Gamma sign. That dealers are net positioned the way the gamma series assume is an assumption. The intraday position in options expiring the same day is missing.
- ES only. Other futures and other exchanges are untested.
What this measurement means for the claims around dealer gamma is placed in context by chapter 10 of the foundations. All pattern families and holdouts in the overview.
📄 Full study as PDF: 8 pages incl. all tables, figures and limits (in German).
Disclaimer: Historical statistics are no guarantee of future market behaviour. This study is not investment advice. Trading carries a risk of loss up to total loss.