Data basis: Nasdaq 100 and DAX as CFDs, Dukascopy minute data, detection on 5-minute candles, execution to the minute, around the clock, search period 2015–2022. The holdout from 2023 stayed untouched because no candidate passed the gate. Costs per round trip as in every study of this series, 2.5 times that outside the cash session. Benchmark: the same detection and execution on two random markets. Pre-registered on 10 November 2026 before any result was calculated, after the detector's example charts had been confirmed as correct (SHA-256 d482bc33…). No trading recommendation.
The idea from trading: a channel forms upwards or downwards, and at some point it breaks toward the side where the stops sit, for a rising channel that is downwards. The target is the last low, protected by a tight trailing stop. Plus the observation that such momentum breaks often recover quickly.
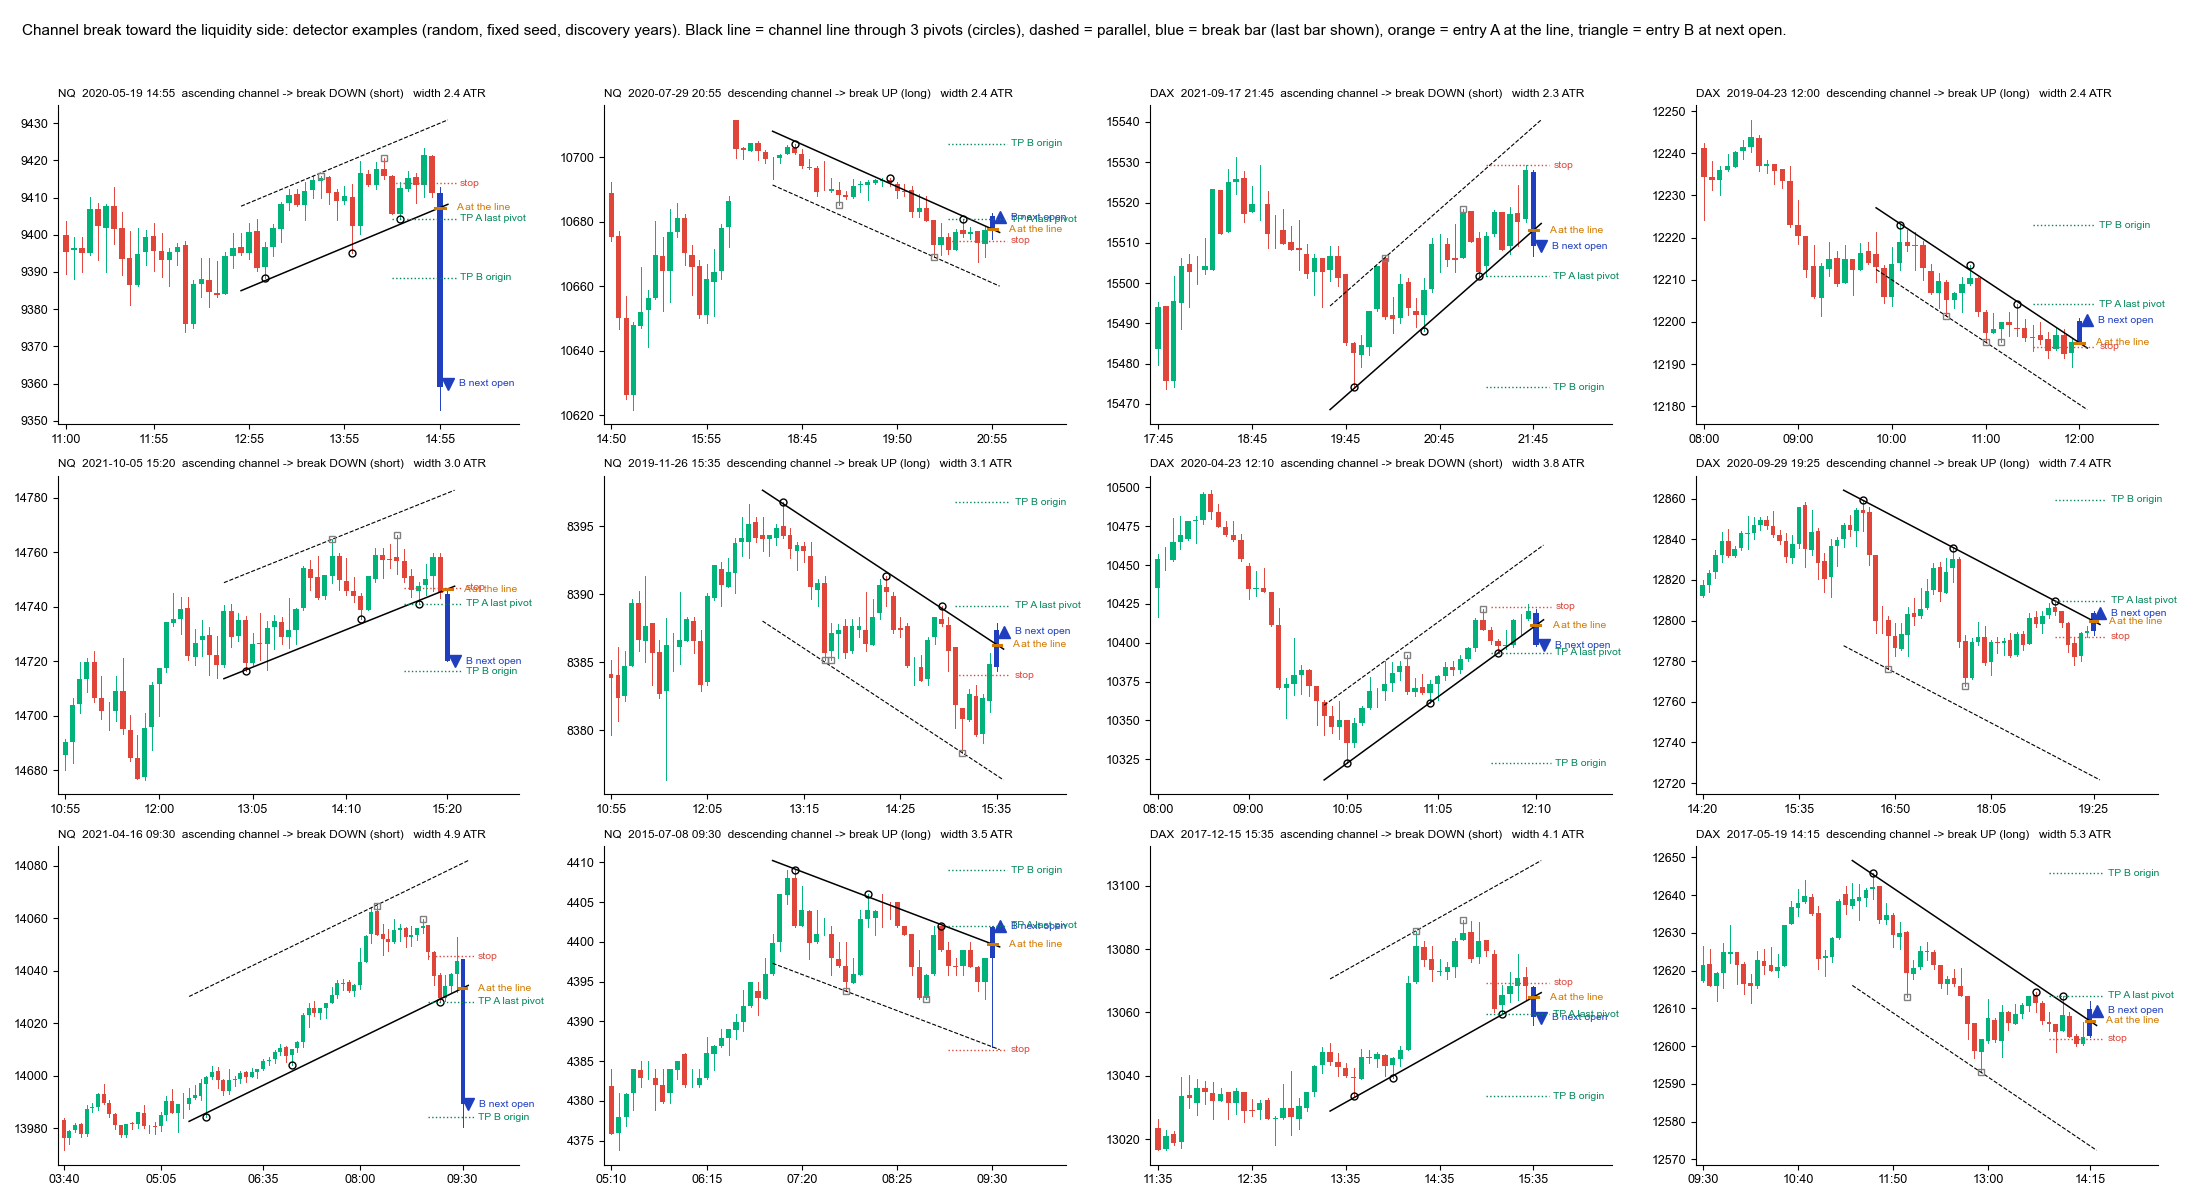
Twelve channels drawn at random with a fixed seed from the search period. Black the channel line through three pivot points, dashed the parallel, blue the break candle, orange entry A at the line, triangle entry B at the next open.
1. The rule
| Component | Definition |
|---|---|
| Channel | three rising pivot lows (extreme within ±3 candles) on one line, 15 to 80 candles, rise at least 1.5 ATR; upper parallel with at least two touches, width 1.5 to 8 ATR. Falling channel mirrored |
| Entry A (primary) | stop order 0.1 ATR beyond the line, every first penetration, stop 1 ATR |
| Entry B | after a momentum close at least 0.3 ATR beyond the line, entry at the next open, stop above the break candle |
| Exits | target last pivot low (primary), target channel origin, let it run, tight trail, fast break-even with or without target |
| Counter-check | after entry B against the break, target the line or exit after 60 minutes |
ATR is the mean true range of the 14 prior 5-minute candles. 14 tests, multiple-testing correction, gate net t ≥ 2 and better than both random markets.
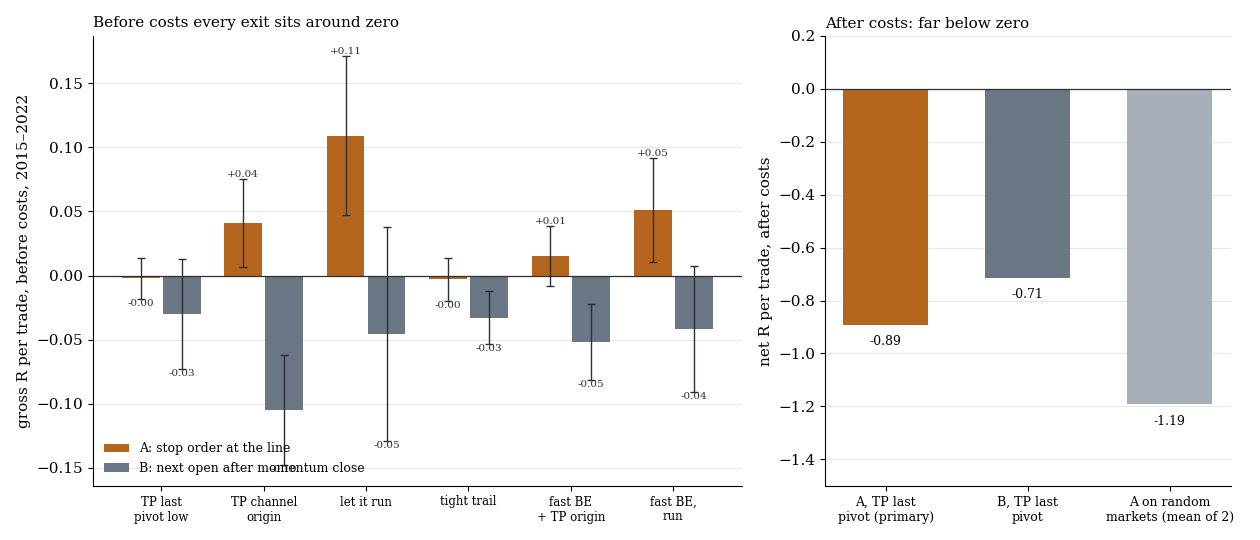
Left gross before costs by exit for both entries, with one standard error. Right net the primary rule, entry B with the same target, and the primary rule on the random markets.
2. Result
| Entry, exit | n | gross R (t) | net R | hit rate |
|---|---|---|---|---|
| A, target last low | 2,985 | −0.002 (−0.13) | −0.891 | 54 % |
| A, target channel origin | 3,309 | +0.041 (1.19) | −0.850 | 25 % |
| A, let it run | 3,309 | +0.109 (1.76) | −0.782 | 16 % |
| A, tight trail | 3,309 | −0.003 (−0.18) | −0.894 | 26 % |
| A, fast break-even, run | 3,309 | +0.051 (1.26) | −0.840 | 6 % |
| B, target last low | 404 | −0.030 (−0.70) | −0.714 | 59 % |
| B, target channel origin | 1,051 | −0.105 (−2.44) | −0.742 | 34 % |
| B, let it run | 1,071 | −0.046 (−0.55) | −0.675 | 20 % |
| Counter-check after B, target the line | 656 | +0.054 (0.78) | −2.596 | 33 % |
| Counter-check after B, 60 minutes | 680 | −0.005 (−0.04) | −2.681 | 13 % |
Search period 2015–2022. Entry A with the target at the last low only when the target is at least 0.3 ATR away.
Before costs all exits sit around zero, no positive value reaches t 2. The high hit rate of 54 to 59 % with the target at the last low is geometry: the target is closer than the stop. After costs everything is clearly negative, because the stops on a 5-minute basis are small; the costs amount to a median of 0.54 R (A) and 0.39 R (B). In the cash session alone the primary rule is at −0.319 R net, negative there too. On the random markets the same rule reaches −1.312 and −1.071 R net. The quick recovery after the break does exist: the line is reached again in 33 % of cases, but gross it is no gain, and trading against the break costs more than 2.5 R net, because the stop there is especially tight.
What this means
The break of a channel line carries no directional information in these markets, neither to the nearby low nor beyond it. No exit rescues an entry without an edge. Related: Chart patterns intraday against a random walk and Smart Money Concepts tested.
Limits
- Pivot channel. The mechanical definition is tighter than a hand-drawn channel.
- Small stops. On 5-minute candles the stops are small against the costs. A higher time frame with a wider stop would be a new test.
- Around the clock. Costs are higher at night, but the cash session alone is negative as well.
- Thresholds set once, not varied.
- Holdout not run, because no candidate passed the gate.
All pattern families and holdouts in the overview.
📄 Full study as PDF: 6 pages incl. all tables, figures and limits (in German).
Disclaimer: Historical statistics are no guarantee of future market behaviour. This study is not investment advice. Trading carries a risk of loss up to total loss.