Data basis: FINRA Daily Short Sale Volume (consolidated file for off-exchange reported trades) for SPY and QQQ, freely available from January 2019. Prices: US500 and NAS100 CFDs, Dukascopy minute data. Search period January 2019 to December 2022. The holdout from 2023 stayed untouched because the gate was missed. Costs per round trip 0.8 index points (US500) and 2.5 points (NAS100), on average 2.3 bps (1 bp = 0.01%), no overnight swap because trades stay inside the cash session. Benchmarks: randomly swapped direction (2,000 times), always long on the same days, random markets. Pre-registered on 19 October 2026 before the data was loaded (SHA-256 32dee4f9…). No trading recommendation.
The short-volume ratio sounds bearish: lots of short volume, so many are betting on falling prices. The popular opposite reading comes from the dark pool index (DIX). Most of this volume comes from market makers who first fill their clients' buy orders by selling short. A high ratio would then stand for buying pressure. We test this reading with the raw data the DIX is built on.
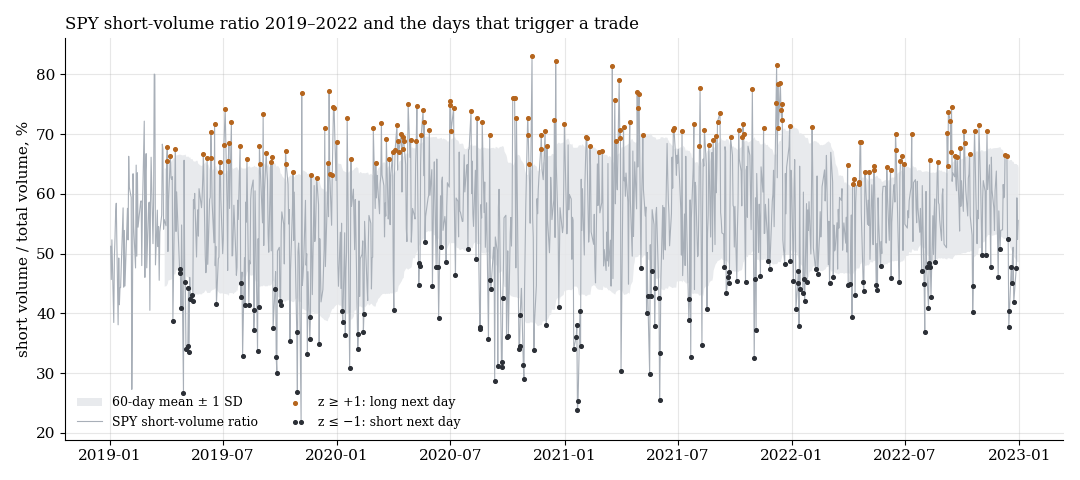
Daily share of short volume in reported SPY volume (grey), the band of mean and standard deviation of the previous 60 days, and the signal days: orange long on the next day (334 days together with the dark short days).
1. Rule
The ratio is short volume divided by total volume. We standardise it against the previous 60 days (z-score). The file appears in the evening and the next cash session is traded: entry 09:31, exit 15:59. Direction follows the DIX logic and was fixed in advance: z above 0 long, below 0 short, only when its absolute value reaches the threshold. Tests: thresholds 0, 1 and 2 for SPY on US500 and QQQ on NAS100. Primary rule: SPY, threshold 1. Gate: net t ≥ 2 in the hypothesised direction and q ≤ 0.10 across six tests.
2. Result
| Signal | Threshold | n | net bps | t |
|---|---|---|---|---|
| SPY → US500 | all days | 947 | −4.77 | −1.53 |
| SPY → US500 | abs. z ≥ 1 | 334 | −5.11 | −1.00 |
| SPY → US500 | abs. z ≥ 2 | 49 | +2.97 | +0.28 |
| QQQ → NAS100 | all days | 947 | +1.71 | +0.42 |
| QQQ → NAS100 | abs. z ≥ 1 | 345 | +7.95 | +1.26 |
| QQQ → NAS100 | abs. z ≥ 2 | 51 | −13.55 | −0.72 |
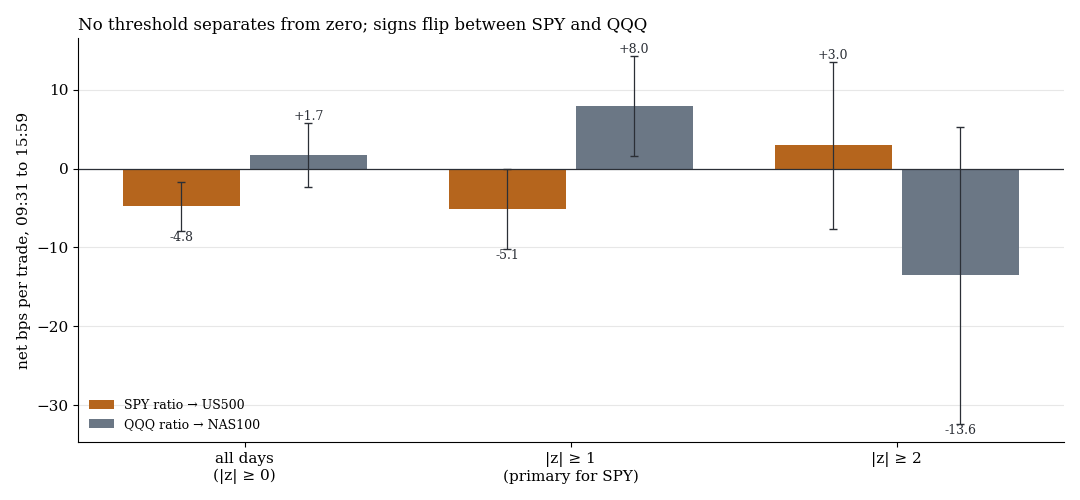
Net per trade with one standard error. No threshold separates from zero, and the signs switch between SPY and QQQ.
The primary rule lost −5.11 bps per trade (t −1.0). Against randomly swapped directions (mean −2.19 bps) it is no better (p 0.70). On two random markets without direction the same rule gives −5.22 and −5.28 bps, practically the same as on real prices. By year: 2019 −3.3, 2020 +9.9, 2021 −11.0, 2022 −16.0 bps. The best cell, QQQ from threshold 1 at +7.95 bps, sits at t 1.3 and is no more than noise among six tests.
What it means
The daily FINRA short-volume ratio carries no directional information for the next trading day that we can measure, neither in the DIX reading nor visibly in the opposite direction. That fits our earlier test of the finished DIX as a daily series, which did not predict direction either (VIX curve, VVIX and dealer gamma).
Limits
- Short period. The free FINRA files only go back to 2019, so the search period covers four years.
- Off-exchange volume only. The file covers trades reported to FINRA, not exchange volume. The DIX also weights across the index stocks, which we did not rebuild.
- One holding window. Only the next cash session intraday. Held for five days, the primary rule was at −10.8 bps gross (descriptive, not tested).
- Not tested: single stocks, other windows for the z-score, combinations with other data.
All pattern families of the scan in the overview. Related: SPY fund flows, Wikipedia attention and fear, sentiment and the moon.
📄 Full study as PDF: 5 pages incl. all tables, figures and limits (in German).
Disclaimer: Historical statistics are no guarantee of future market behaviour. This study is not investment advice. Trading carries a risk of loss up to total loss.