Data basis: Daily shares outstanding of SPY from State Street's freely available NAV history. Prices: US500 CFD, Dukascopy minute data. Search period 2015 to 2022. The holdout from 2023 stayed untouched because the gate was missed. Costs per round trip 0.8 index points, on average 2.7 bps (1 bp = 0.01%), no overnight swap. Benchmarks: randomly swapped direction (2,000 times), always long on the same days, random markets. Pre-registered on 19 October 2026 before the data was loaded (SHA-256 32dee4f9…). No trading recommendation.
When investors buy more SPY than the market offers, authorised participants create new shares and buy the index stocks to do so. With outflows it runs the other way. Whether such flows push the market in the short term and the pressure then fades is an old question. The number of shares outstanding is public every day, so it can be tested at no cost.
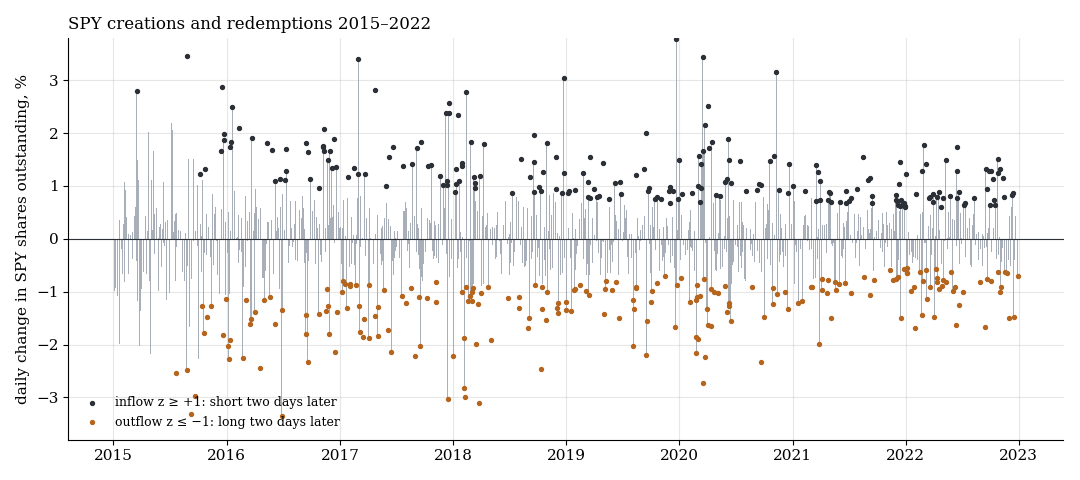
Daily change in shares outstanding in percent. Dark: unusually large inflows (short two trading days later), orange: unusually large outflows (long).
1. Rule
A day's flow is the percentage change in shares against the previous day. We standardise it against the previous 250 reports (z-score). Because the report reflects the previous day's orders and appears with a delay, we trade only on the second trading day after it, safely without lookahead. Direction fixed in advance: against the flow, so short after inflows and long after outflows, when the absolute z-score reaches the threshold. Trade on the US500 CFD from 09:31 to 15:59. Thresholds 0, 1 and 2. Primary rule: threshold 1. Gate: net t ≥ 2 and q ≤ 0.10 across three tests.
2. Result
| Threshold | n | net bps | t | gross bps |
|---|---|---|---|---|
| all days | 2,012 | −2.38 | −1.29 | +0.50 |
| abs. z ≥ 1 | 430 | −1.84 | −0.38 | +0.90 |
| abs. z ≥ 2 | 100 | −0.88 | −0.07 | +1.94 |
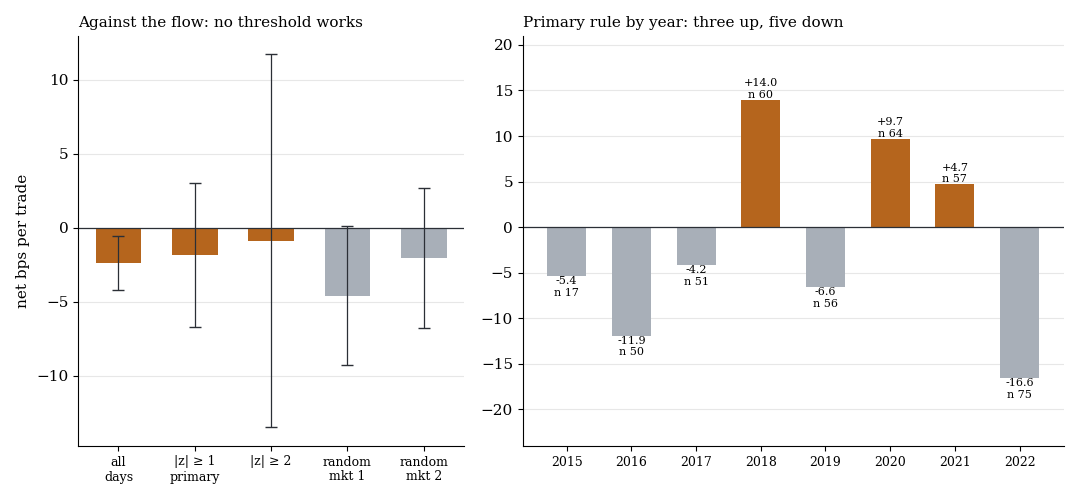
Left: net per trade with one standard error, plus the same rule on two random markets. Right: the primary rule by year with the number of trades.
No threshold comes close to significance. Against randomly swapped directions (mean −2.66 bps) the primary rule is no better (p 0.42). Always long on the same days made +3.15 bps gross, more than the rule. On two random markets the same rule gives −4.58 and −2.04 bps. The years switch without a pattern: 2018, 2020 and 2021 positive, 2015, 2016, 2017, 2019 and 2022 negative.
What it means
A single day's flow of the largest index ETF is too small to push the index in a measurable direction two days later. Held for five days, the primary rule was at +11.1 bps gross. That is descriptive, was not tested, and overnight swap costs would come on top.
Limits
- SPY only. The history of other ETFs such as QQQ is not freely available.
- Delay. We deliberately trade only two days after the flow. A faster effect on the next day is not tested.
- Data quality. Shares outstanding are the issuer's figure. We did not treat corrections or reporting gaps separately.
- Not tested: with the flow instead of against it, multi-day holding periods with swap, aggregated flows across all S&P 500 ETFs.
All pattern families of the scan in the overview. Related: FINRA short volume, forced flows, second round and two forced flows: shock days and fiscal year end.
📄 Full study as PDF: 5 pages incl. all tables, figures and limits (in German).
Disclaimer: Historical statistics are no guarantee of future market behaviour. This study is not investment advice. Trading carries a risk of loss up to total loss.