Data basis: Daily views of five English Wikipedia articles (Stock market crash, Recession, Bear market, Stock market, S&P 500), users only, via the Wikimedia API from July 2015. Prices: US500 and NAS100 CFDs, Dukascopy minute data. Search period July 2015 to December 2022. The holdout from 2023 stayed untouched because the gate was missed. Costs per round trip 0.8 index points (US500) and 2.5 points (NAS100), on average 2.8 and 3.2 bps (1 bp = 0.01%), no overnight swap. Benchmarks: always long on the same days, random markets. Pre-registered on 19 October 2026 before the data was loaded (SHA-256 32dee4f9…). No trading recommendation.
Attention can be measured. A widely cited paper by Moat and colleagues (2013) found that more views of financial articles on Wikipedia preceded price declines. Other findings say the opposite: fear spikes often mark the end of a sell-off. Because the literature is contradictory, we did not fix the direction in advance, but only asked whether the day after a spike differs measurably from chance.
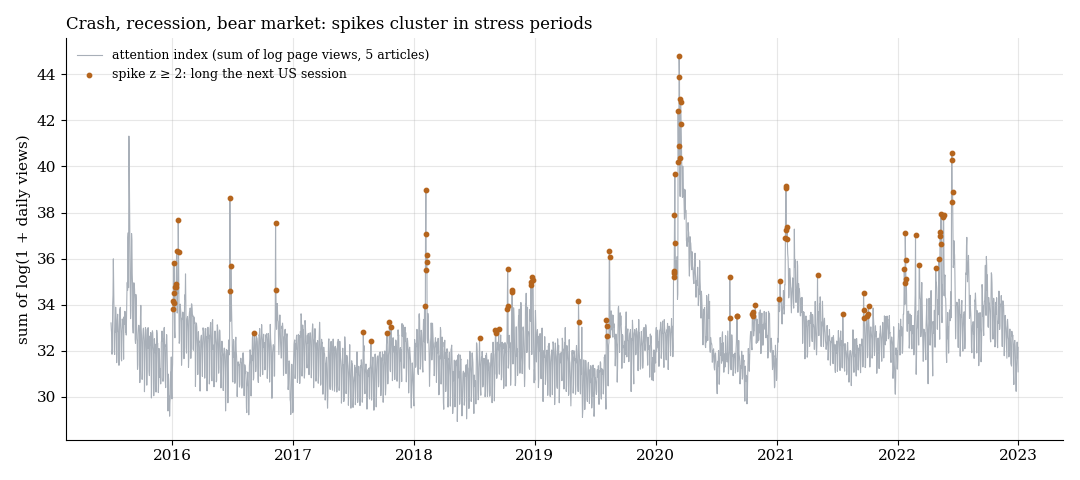
Sum of the logged daily views of the five articles (grey) and the 106 spike days (orange). They cluster in stress periods: early 2016, February 2018, late 2018, March 2020 and 2022.
1. Rule
The index is the sum of the logged daily views of the five articles, chosen in advance. The Wikipedia day ends at midnight UTC, after the New York close. A spike is a day on which the index is at least two (or three) standard deviations above the mean of the previous 60 days. On the next cash session we hold the US500 or NAS100 CFD long from 09:31 to 15:59. The measure is two-sided: had the mean been clearly negative, the holdout would have traded short. Primary rule: US500, threshold 2. Gate: absolute t ≥ 2 and q ≤ 0.10 across four tests.
2. Result
| Market | Threshold | n | net bps | t |
|---|---|---|---|---|
| US500 | z ≥ 2 | 106 | +10.27 | +0.72 |
| US500 | z ≥ 3 | 36 | +12.29 | +0.44 |
| NAS100 | z ≥ 2 | 106 | +13.40 | +0.80 |
| NAS100 | z ≥ 3 | 36 | +16.81 | +0.54 |
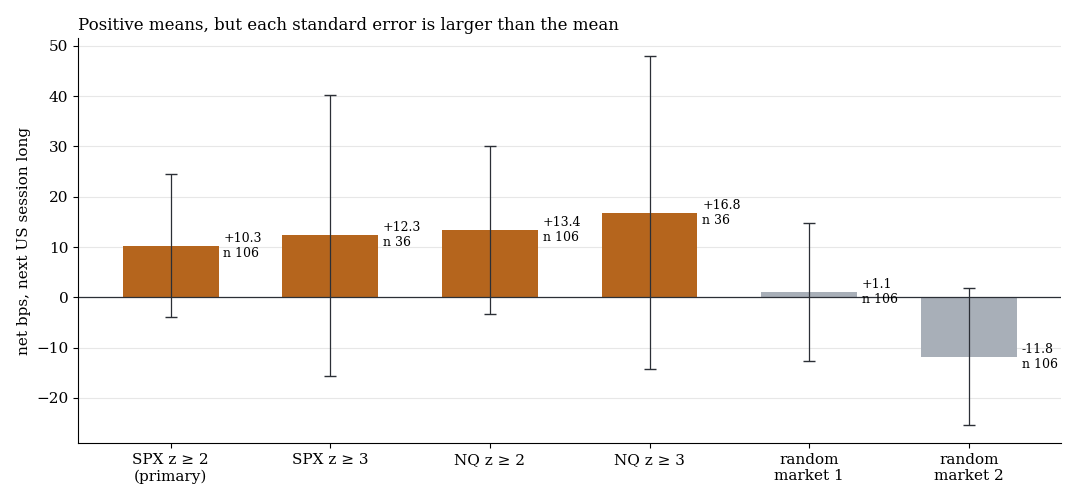
Net per trade with one standard error. The means are positive, but the standard errors are larger than the means. On the random markets the same rule sits at +1.1 and −11.8 bps.
The days after a spike swing widely, one standard error is 14 bps or more. The mean of the primary rule is exactly what the market did on those days anyway (always long +13.04 bps gross). The years scatter widely: 2016 −13.4, 2017 −13.4, 2018 +14.4, 2019 +79.3 (only seven days), 2020 +19.4, 2021 +23.8, 2022 −14.3 bps. Held for five days, US500 at z ≥ 3 is at −76 bps gross (36 cases, descriptive).
What it means
Attention spikes fall into stress periods, and in stress periods the following days are wide. No direction for the next day can be read from them. The positive sign fits the idea that fear marks a low, but it lies well within chance.
Limits
- Small sample. 106 spike days, only 36 at z ≥ 3. An effect below about 30 bps cannot be detected with that.
- Article choice. We chose the five articles before looking at the data. Other articles, languages or Google searches may look different.
- One holding window. Only the next cash session intraday.
- Not tested: views of single companies, changes instead of levels, combination with volatility data.
All pattern families of the scan in the overview. Related: fear, sentiment, moon, FINRA short volume and the day after large US moves.
📄 Full study as PDF: 6 pages incl. all tables, figures and limits (in German).
Disclaimer: Historical statistics are no guarantee of future market behaviour. This study is not investment advice. Trading carries a risk of loss up to total loss.