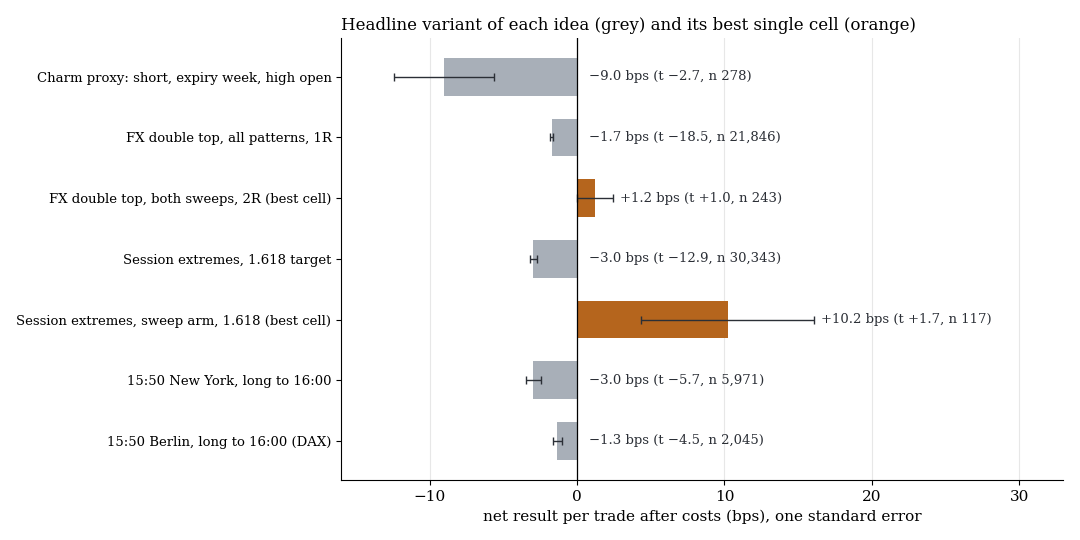
Data basis: Index CFDs on the S&P 500, Nasdaq 100, Dow and DAX plus EURUSD, GBPUSD, USDJPY and gold, Dukascopy minute data (BID). Search period 2015–2022, 970 pre-registered tests. The holdout from 2023 to June 2026 (separate period, one run) stayed untouched because no test reached the gate to it. Costs per round trip: 1.2 to 1.5 bps (FX), 1.7 to 3.6 bps (US indices), 2.0 bps (DAX); 1 bp = 0.01%. Benchmarks: random-walk rate, random entries (same time of day and geometry), random markets (mirrored candles, no direction). No trading recommendation.
Four ideas circulate in trader forums. With negative charm, dealers (option market makers) sell every high at the session start, hedging at the best price. An FX double top in which price sweeps the stops above the first high (sweep) and undercuts an interim low (internal sweep) is a reliable short. Double tops at session extremes run to Fibonacci extensions. And: “every day at 15:50 it rises.”
We tested all four like the rest of the scan: rules fixed in advance, costs deducted, chance as benchmark. The t-value shows how far a result lies above the noise (notable from 2). The random-walk rate is the hit rate of a price without direction.
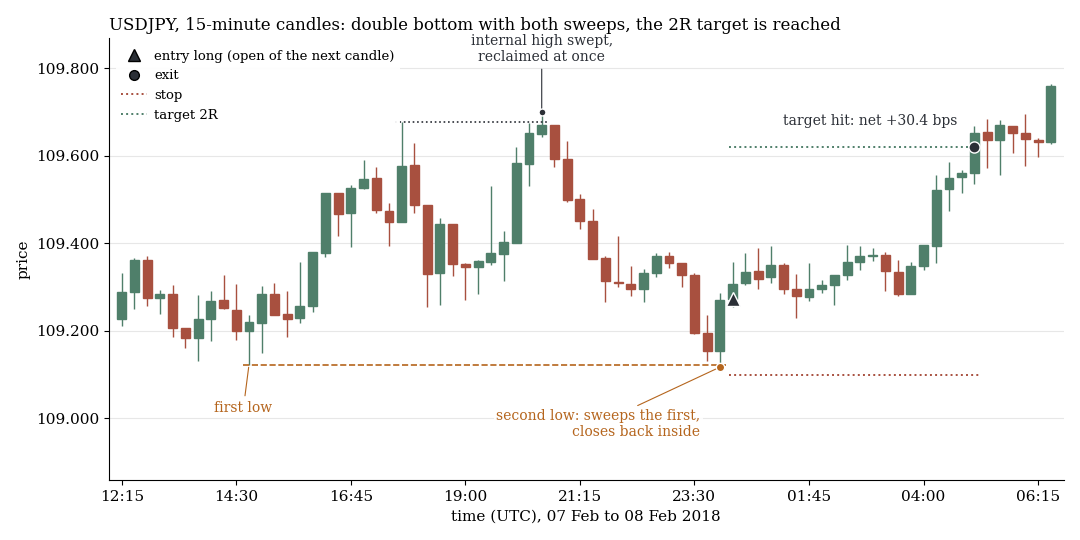
USDJPY, 8 February 2018: double bottom (a mirrored double top) with both sweeps, 2R target (twice the stop distance) reached, +30.4 bps after costs.
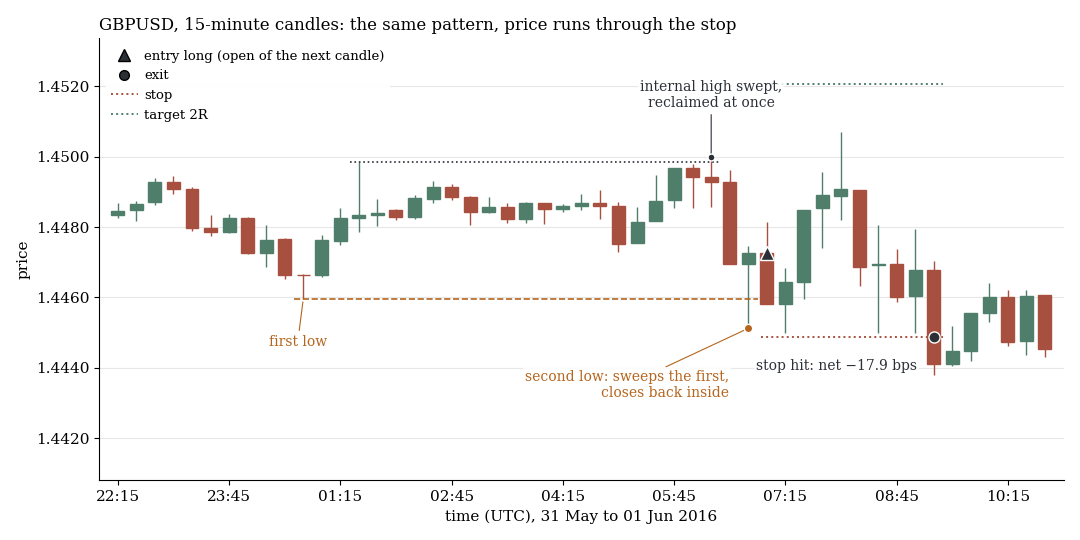
GBPUSD, 1 June 2016: the same pattern, stop hit, −17.9 bps. Both examples were drawn at random (fixed seed 7) from the 243 trades of this pattern (86 hit the target, 127 the stop).
1. Charm: highs are not sold at the start of the session
Charm describes how an option's delta changes with time. The sign is a trap: in the academic convention negative dealer charm means buying demand, with data vendors selling demand, and under the standard assumption of common GEX calculators the dealer buys back hedges over time.
Without historical open interest (open option contracts per strike) the sign could not be measured. We tested expiry week (Monday to Thursday before the third Friday), when charm flows should be largest, after a high open (the first minute closes above the previous day's high, 26% of days). In the three US indices (278 market days) the first hour then makes +6.3 bps, otherwise +1.5 (t 1.2). After a new high the next 30 minutes fall in only 44 to 48% of cases.
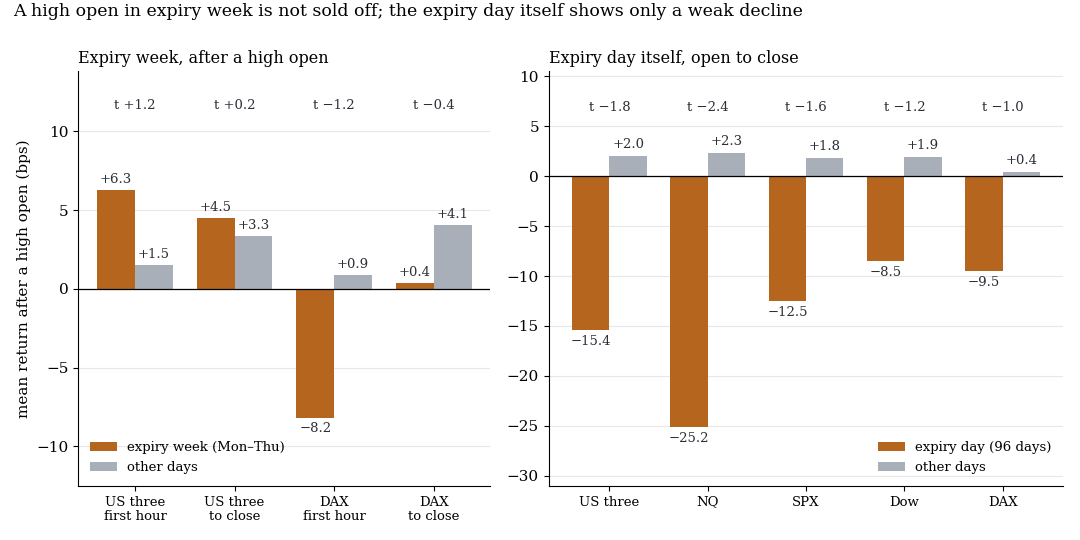
Return in bps. Left: after a high open, right: the expiry day itself (96 days per market). Above each pair: t of the difference.
So neither an immediate sell-off nor “every high” is sold. A short rule on the first hour lost 9.0 bps net per trade (t −2.7). In the DAX it makes +6.1 bps net (t 0.8), within the range of random markets.
The only direct charm measurement is a working paper (Baltussen, Terstegge and Whelan 2024): from Thursday's close to the opening settlement on expiry day the S&P 500 gains 18 basis points (t 3.5, 2003–2021) and gives it back by noon. In our data, on expiry day after a rise overnight a short in the Nasdaq 100 made +35 bps net (t 2.46, 55 days), just below our threshold of t 2.5. No source supports that dealers hedge “at the best price”: the literature describes rule-based hedging, mostly at the end of the day (Baltussen et al. 2021).
2. FX double top with sweep and internal sweep: like chance
A double top is a second test of a swing high, six to 60 candles later, within 0.1 typical daily ranges (ATR) and with a rejection candle. In a sweep the second high pokes up to 0.1 ATR above the first and closes back below it; in an internal sweep the last interim low is briefly undercut and reclaimed within three candles. Short at the next candle, target 1R (as far as the stop), 2R or the neckline: 188,970 trades in EURUSD, GBPUSD, USDJPY and gold on 5- and 15-minute candles.
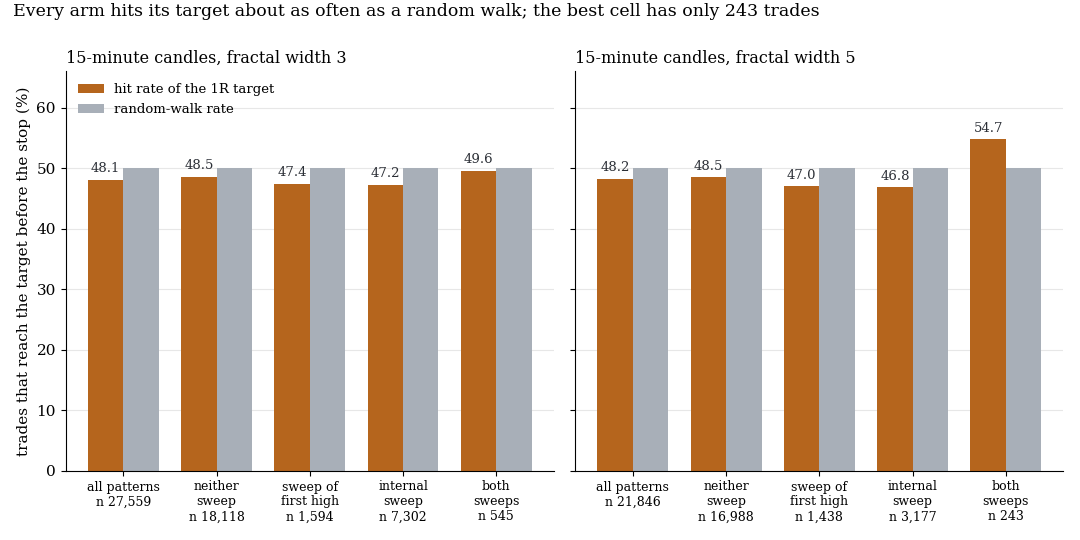
Hit rate of the 1R target by arm (orange) against the random-walk rate (grey), 15-minute candles, three FX pairs. Only the smallest cell lies above 50%.
All arms except both sweeps combined end net at minus costs (−1.0 to −2.2 bps). Against random entries the 27,559 double tops on 15-minute candles do worse (−0.41 bps, t −4.2): after a rejection price tends to run on to the high. The internal sweep changes nothing (−0.6 to +0.04 bps against the pattern without a sweep). Only the combination of both sweeps has a positive sign with the 2R target (net +0.8 and +1.2 bps, t 0.8 and 1.0; best cell 243 trades, hit rate 40.4% against 33.3%), not on 5-minute candles. Ten random markets give −1.03 to +1.33 bps gross for these cells, the real ones average +1.59: about two standard deviations, for six of 300 cells chosen in advance.
3. Fibonacci targets at session extremes: the target choice changes nothing
We tested double tops and double bottoms at Asia, London, prior-day and running session extremes (tolerance 0.1 or 0.25 ATR): 49,975 trades on 5-minute candles in six markets. The Fibonacci targets project the pattern height from the neckline at 0.618, 1.0, 1.272 and 1.618, plus 1R and 2R, exit at session end.
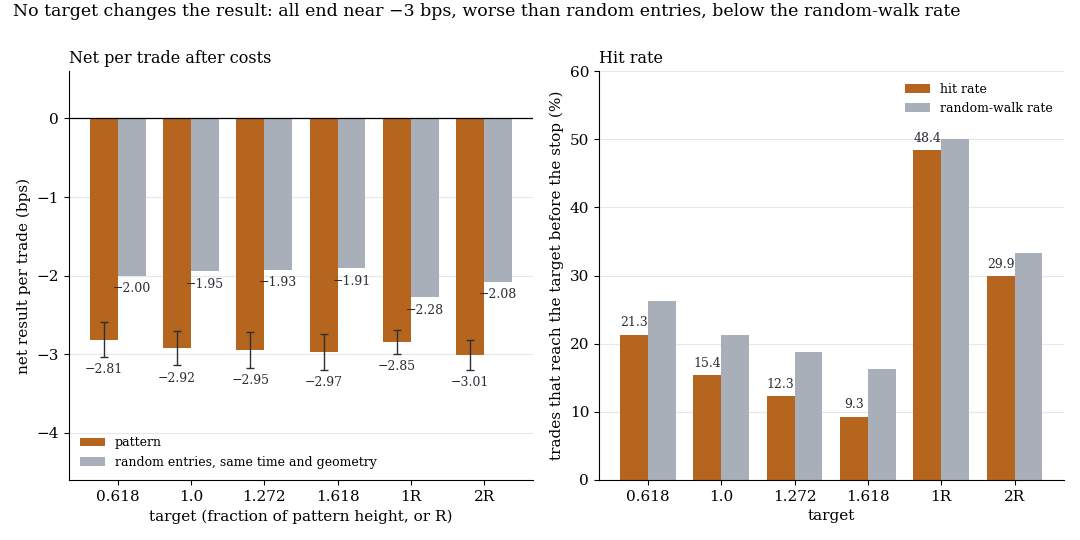
Left: net per trade with one standard error, pattern (orange) against random entries (grey); right: hit rate against the random-walk rate. Tolerance 0.1 ATR, about 30,300 trades per target.
All targets end at −2.7 to −3.0 bps per trade (both tolerances). Paired differences against 1R lie between −0.23 and +0.04 bps (|t| at most 1.3), as on the random market. Targets only trade hit rate against win size: the 1.618 target is reached in 9.3% of trades, the random-walk rate is 16.2%, because the session ends first. Against random entries the patterns are 0.6 to 1.1 bps worse (t −3 to −4): after the rejection price runs on slightly towards the extreme. The best cell (sweep arm, tolerance 0.25) has 117 trades, +6.6 to +10.2 bps (t 1.3 to 1.7), as chance would across 180 rule rows.
4. 15:50: the best window in Berlin time, but a third of the costs
“15:50” is ambiguous. In New York the NYSE publishes the closing-auction imbalances at that time (since 1 April 2019); in Berlin, 15:50 is twenty minutes after the US open. No source documents an upward drift from 15:50.
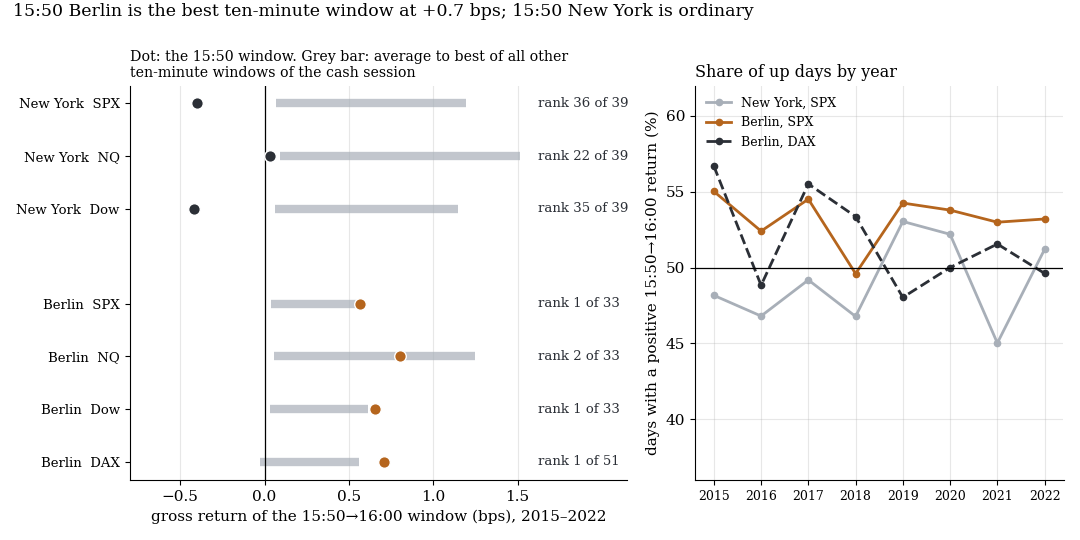
Left: gross return of the 15:50 to 16:00 window (dot) against the average to the best of the other ten-minute windows (grey), with rank. Right: days up by year.
In New York nothing rises to 16:00: −0.26 bps gross (t −0.5), 49.7% of days up, −2.96 bps net (5,971 trades, t −5.7). To 16:14 (quoted on about 60% of days) it is +1.3 bps gross (t 1.5), −2.6 bps net. In the Berlin reading, 15:50 to 16:00 is indeed one of the best ten-minute windows of the cash session gross (rank 1 to 2 in all four markets, 1 of 51 in the DAX): in the DAX +0.71 bps gross (t 2.4, 2,045 trades), −1.34 bps net (t −4.5). But it rises on only 52 to 53% of days, not “every day”, and +0.7 bps is a third of the costs of 2.0 bps. Net, every variant loses, including the windows to 16:30 and 17:30 in Berlin, and no rule row of 168 reaches net t 2.
What it means
No idea holds after costs. The mechanisms exist, their size does not suffice. After the correction for 970 tests (Benjamini-Hochberg; q is the error probability adjusted for the number of tests) the smallest q is 1.00. Of 788 rule rows, 70 are positive net, none with t of 3 or more.
Limits
- Costs. Fixed costs; real fills are likely worse.
- Period. All results come from 2015–2022 and say nothing about the zero-day-option era after 2022. Before 1 April 2019 the NYSE published its imbalances at 15:45.
- Charm only as a proxy. Without historical open interest the sign is not measured. Cells of 80 to 280 days cannot detect effects below about 8 bps in the first hour.
- Not tested: the sign of charm itself, other tolerances and swing widths (earlier studies with other sets found the same), futures, single stocks.
All pattern families of the scan in the overview. Related: Fibonacci zones as a forecast, smart money patterns and chart formations intraday.
📄 Full study as PDF: 9 pages incl. all tables, figures and limits (in German).
Disclaimer: Historical statistics are no guarantee of future market behaviour. This study is not investment advice. Trading carries a risk of loss up to total loss.