Data basis: Daily data from Yahoo Finance for the S&P 500 (SPY), Nasdaq 100 (QQQ), Dow (DIA), Russell 2000 (IWM), DAX, gold (GLD) and Bitcoin, plus the VIX from Cboe (US markets only). Search period 2000–2018. The 2019–2026 holdout stayed untouched because the gate was missed. Costs as in the pullback study: spread per market, overnight financing (interest plus 2.5% a year) and dividend assumptions. Benchmarks: random entries on days inside a calm trend with the same holding period, 20 random markets. Pre-registered on 21 October 2026 before the first calculation (SHA-256 5dc84a49…). No trading recommendation.
Every trader knows the idea: a market rises for weeks, quietly, with small pullbacks and low volatility. At some point the rise gets steeper and momentum picks up. The mechanism usually named is dealer hedging: whoever sold call options has to buy more as the price rises, and when the VIX rises at the same time the effect feeds on itself. If you spot the acceleration early, the hope goes, you ride the melt-up.
We measured this in three forms and asked whether the price keeps rising after the acceleration, and by more than on any other day of the same calm trend.
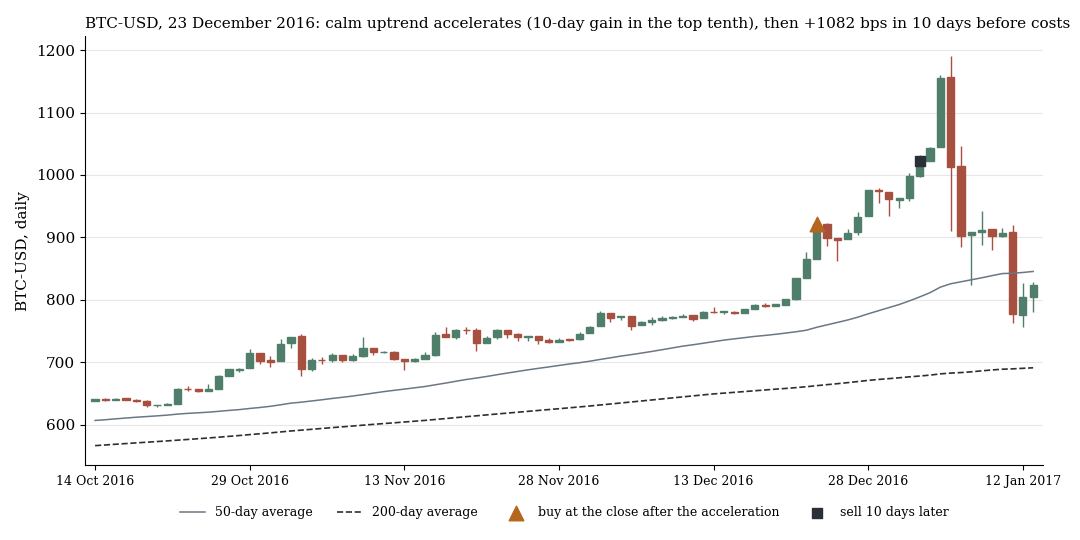
Example with a gain: buy at the close after the acceleration, sell ten days later. The number in the title is before costs.
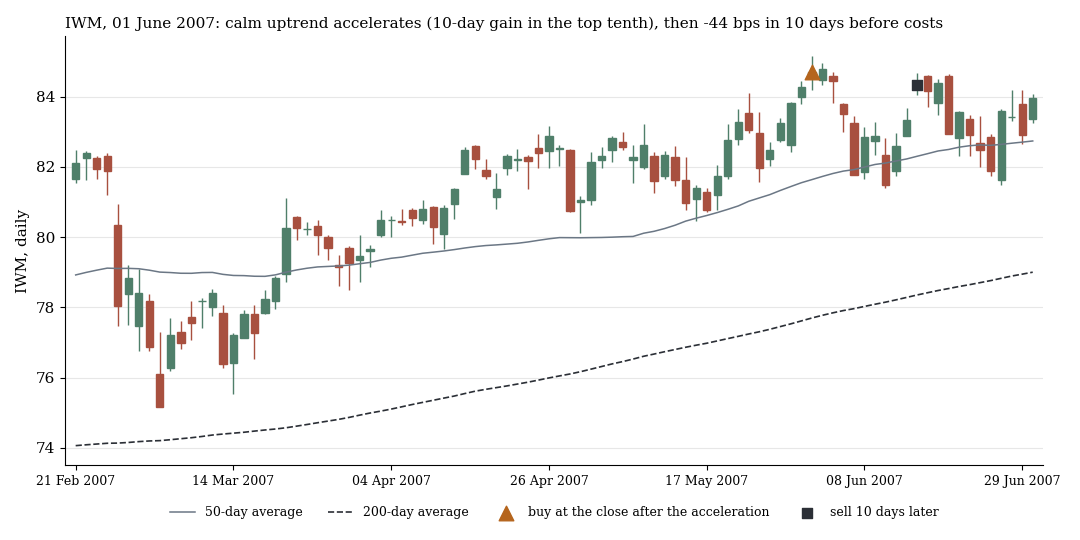
Example with a loss, same trigger. Both cases were drawn at random with a fixed seed (7) from the trigger cases of the search period, not picked.
1. The rules
A calm trend exists when the close is above the 50-day average, that above the 200-day average, and the 20-day volatility is in the lower third of the last 250 days. A trigger counts only if a calm trend already held ten days earlier.
| Trigger | Definition |
|---|---|
| T1 acceleration (primary) | 10-day return in the top tenth of the last 500 days and the close at a 60-day high |
| T2 volatility expansion | volatility of the last 5 days at least 1.5 times the volatility of the last 20 days, the close at a 20-day high |
| T3 price and VIX up | on 2 of the last 3 days both price and VIX rose, the close at a 20-day high (US markets only) |
Long at the close of the trigger day, exit after 5, 10 or 20 trading days, one position per market. That makes nine tests, pooled across markets, with multiple-testing correction (Benjamini-Hochberg). Primary rule: T1 with 10 days. Gate: net t ≥ 2, q ≤ 0.10 and above the 95th percentile of random days in a calm trend.
2. Result: no trigger beats the random day
| Trigger | Holding period | n | net bps | t | Random day in a calm trend: mean / 95th percentile |
|---|---|---|---|---|---|
| T1 | 5 days | 83 | +44.45 | 1.60 | +16.78 / +63.09 |
| T1 | 10 days | 72 | +38.52 | 0.91 | +36.85 / +113.27 |
| T1 | 20 days | 71 | +148.66 | 1.68 | +73.68 / +175.07 |
| T2 | 5 days | 107 | +27.51 | 1.06 | +14.52 / +53.63 |
| T2 | 10 days | 100 | +10.57 | 0.31 | +34.90 / +88.87 |
| T2 | 20 days | 95 | +61.98 | 0.99 | +67.23 / +150.64 |
| T3 | 5 days | 104 | −1.72 | −0.10 | +7.63 / +35.52 |
| T3 | 10 days | 88 | +15.05 | 0.56 | +20.68 / +60.06 |
| T3 | 20 days | 78 | −38.29 | −0.88 | +42.60 / +109.88 |
Net bps per trade, search period 2000–2018, pooled across markets.
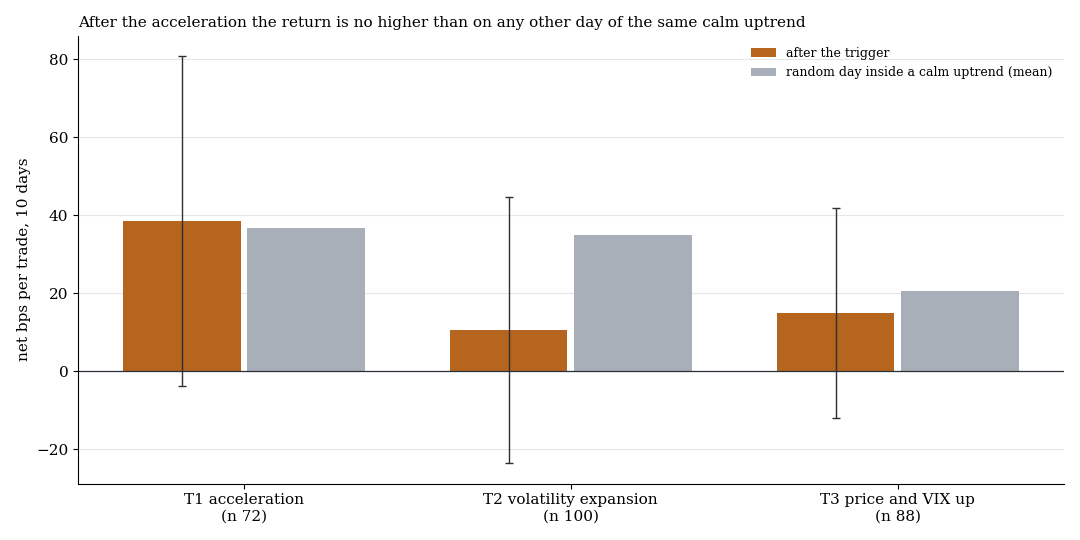
Net per trade after 10 days, orange after the trigger with one standard error, grey the mean of random days in the same calm trend.
The primary rule earned +38.52 bps (t 0.91, q 0.32). A random day in a calm trend earned +36.85 over the same ten days. The trend itself carries the return, the acceleration adds nothing. For T2 and T3 the trigger after 10 days is even below the random day (+10.57 against +34.90 and +15.05 against +20.68). The only high value, T1 after 20 days at +148.66 bps, stays below the 95th percentile of random days (+175.07). On 20 random markets the primary rule averaged −15.47 bps (range −176.77 to +71.50). No candidate passed the gate, so there was no holdout run.
3. Descriptive: the crash risk is higher
We also counted how often the price fell 5% or more below the entry within 20 days after entering.
| Trigger | Share after the trigger | Share on random days in a calm trend |
|---|---|---|
| T1 acceleration | 17.3–18.9% | 11.9–13.5% |
| T2 volatility expansion | 16.4–18.7% | 12.0–14.7% |
| T3 price and VIX up | 19.7–22.6% | 12.0–13.6% |
Three holding periods each, search period 2000–2018, n per cell 71 to 107.
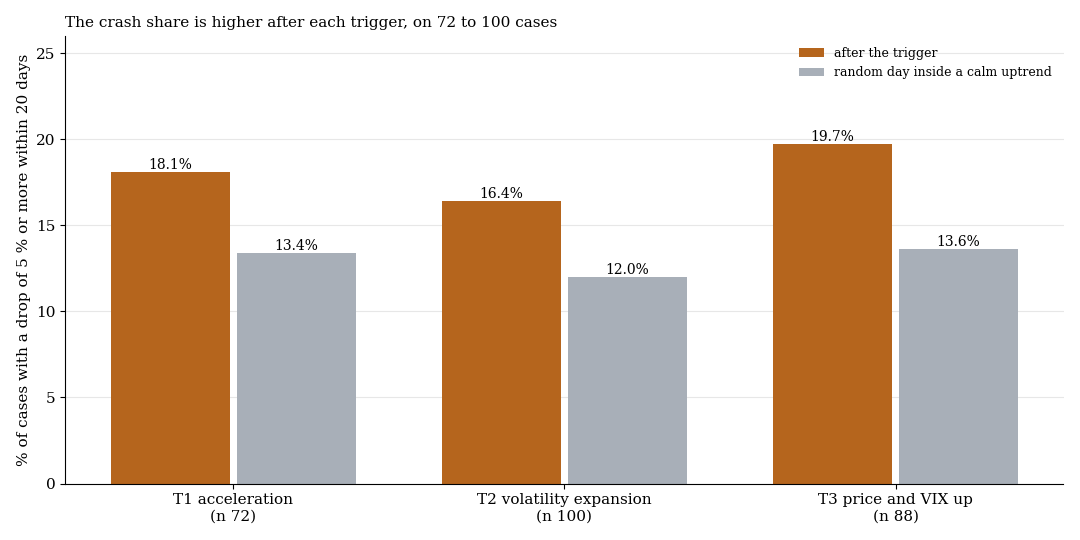
Share of cases with a drop of 5% or more within 20 days (10-day holding period), after the trigger against random days in the calm trend.
All three triggers sit above the random level, most clearly price and VIX up together. That fits the literature: Greenwood, Shleifer and You (2019) found that crashes become more frequent after strong rises without the average return getting worse. We did not register this difference as a test in advance, and with 71 to 107 cases per cell it is a hint, not proof. The three holding periods of one trigger rest on the same events.
What it means
A calm rise that gets steeper is on average no better long opportunity than any other day of the same rise. Whoever enters after the acceleration pays costs and carries a somewhat higher risk of a setback. We did not test the finding as a pre-registered short signal and therefore cannot offer it as a rule.
Limits
- Translation of “escalates”. The three triggers are our definitions. Thresholds such as the top tenth or the factor 1.5 were chosen, not optimised.
- Small samples. 71 to 107 triggers per cell, pooled over seven markets. The standard error of the primary rule is about 42 bps, so small effects cannot be seen.
- Order book not measurable. The often-cited “thin order book depth” before the melt-up cannot be checked with CFD prices that carry no depth.
- Daily closes. Entry and exit at the close, which for indices is the auction price a CFD does not get exactly.
- Holdout not run. The gate was missed, the 2019–2026 period stayed untouched.
- Not tested: the short side as a pre-registered rule, stop variants, single stocks, intraday acceleration (see the intraday study).
All pattern families and holdouts in the overview. Related: RSI(2) on US index CFDs, gold trend following is long beta and our workflow since October 2026.
📄 Full study as PDF: 7 pages incl. all tables, figures and limits (in German).
Disclaimer: Historical statistics are no guarantee of future market behaviour. This study is not investment advice. Trading carries a risk of loss up to total loss.