Data basis: Daily data from Yahoo Finance from 2000 for nine indices (Russell 2000 via IWM, DAX, FTSE 100, CAC 40, SMI, Euro Stoxx 50, Nikkei 225, Hang Seng, ASX 200), plus gold (GLD), EURUSD and bitcoin; SPY, QQQ and DIA for comparison only. Search period 2000–2018, separate holdout 2 January 2019 to 16 October 2026, run exactly once. Before the holdout a data check on Dukascopy CFD minute data 2015–2018. Costs per round trip 2 to 4 bps per index, gold 2, EURUSD 1.5, bitcoin 10 bps, plus overnight financing (interest plus 2.5% a year) and dividend assumptions. Benchmarks: random entries with the same holding time (1,000 times), 20 random markets. Pre-registered on 21 October 2026 before the price series were loaded (SHA-256 3e77eded…), three addenda before the holdout (1c655c43…, d68763b7…, cb7db766…). No trading recommendation.
Buying after a short, sharp sell-off provides liquidity to those who have to sell, and it pays when the price comes back. On the S&P 500, Nasdaq 100 and Dow exactly this rule passed our holdout: RSI(2) below 10 above the 200-day average, +48 bps per trade after costs. The obvious question: is this a general mechanism that carries on other markets just as well, or a peculiarity of the US indices?
To answer it we tested the whole family, five rules, each long and short, with and without a trend filter, on twelve independent markets.
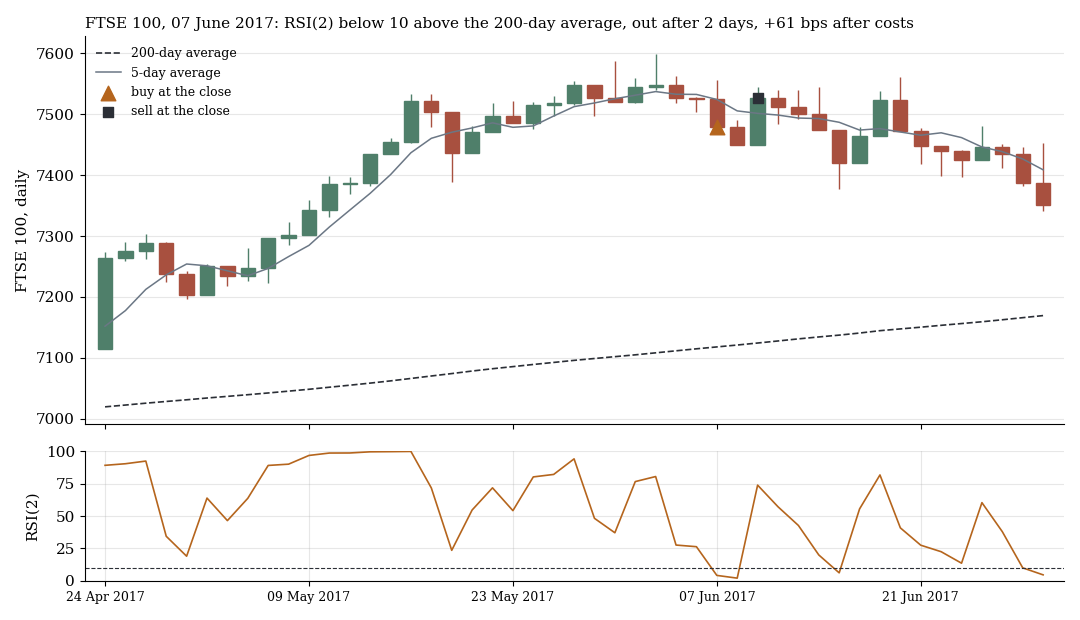
FTSE 100, 7 June 2017: RSI(2) drops below 10 while the index is above its 200-day average. Buy at the close, sell at the first close above the 5-day average two days later, +61 bps after costs.
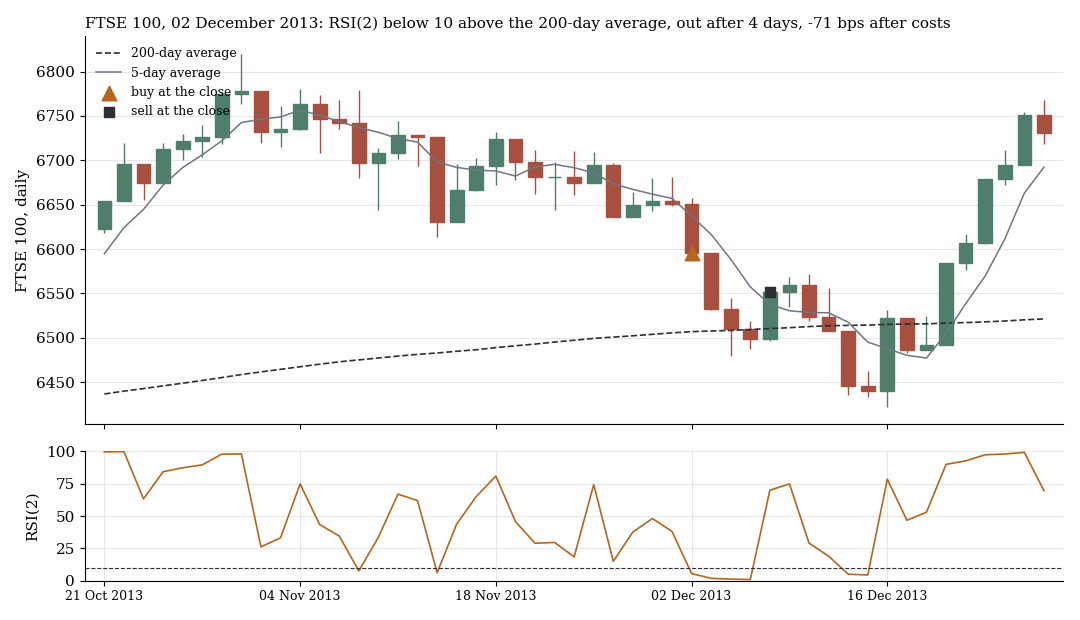
FTSE 100, 2 December 2013: the same signal, the price keeps falling, exit after four days at −71 bps. Both trades were drawn at random with a fixed seed (7) from the rule's winning and losing trades in the FTSE 2000–2018.
1. The rules
| Rule | Long entry (short mirrored) | Exit |
|---|---|---|
| RSI(2) < 10 | close with RSI(2) below 10 | first close above the 5-day average |
| RSI(2) < 5 | the same, stricter | as above |
| IBS < 0.2 | close in the lower fifth of the day's range | next close |
| 7-day low | close at the lowest level of the last seven days | close at the highest level of the last seven days |
| three lower closes | third lower close in a row | first higher close |
Each rule ran long and short, once with a trend filter (long only above, short only below the 200-day average) and once without, with a maximum holding time of 20 days. That makes 20 rules on 15 markets, 240 of them independent cells. The primary rule was fixed in advance: RSI(2) long with the trend filter, pooled across the nine indices. Pooled tests use a t that counts simultaneous trades in the same week as one block, stricter than the simple t.
2. The search period: passed
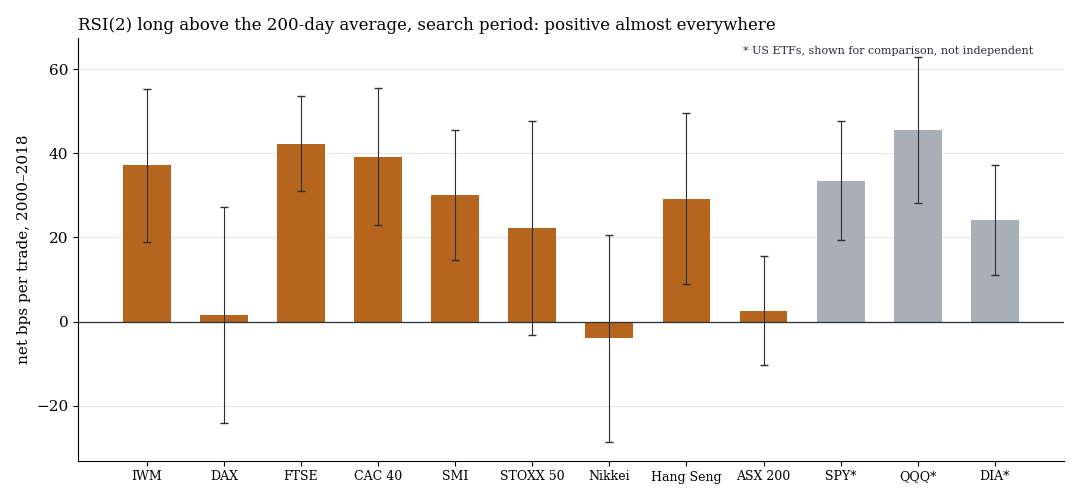
RSI(2) long above the 200-day average, net per trade with one standard error, 2000–2018. Grey for comparison: the US ETFs.
The primary rule earned +22.35 bps per trade after costs across the nine indices (1,066 trades, t 2.27), +30.9 bps gross. Random entries with the same holding time averaged +0.3 bps, their 95th percentile was +10 bps. On 20 random markets the same rule averaged −4.0 bps. The gate was passed.
Beyond that, 35 of the 240 independent cells had a t of 2 or more, where about six would be expected by chance. 27 survived the multiple-testing correction across all 240. There were two warning signs already: with entry at the next open instead of the close only +8.7 bps remained (t 0.9), so a large part depends on the closing price. And on the DAX, Nikkei and ASX 200 the rule was close to zero even in the search period.
3. The data check before the holdout
Before a candidate may enter the holdout, we recompute it on real CFD minute data, here for 2015–2018. For EURUSD this exposed a data error. The IBS rule showed gains with t 12 to 17 on the free daily candles, long and short alike, a size that practically does not exist in markets.
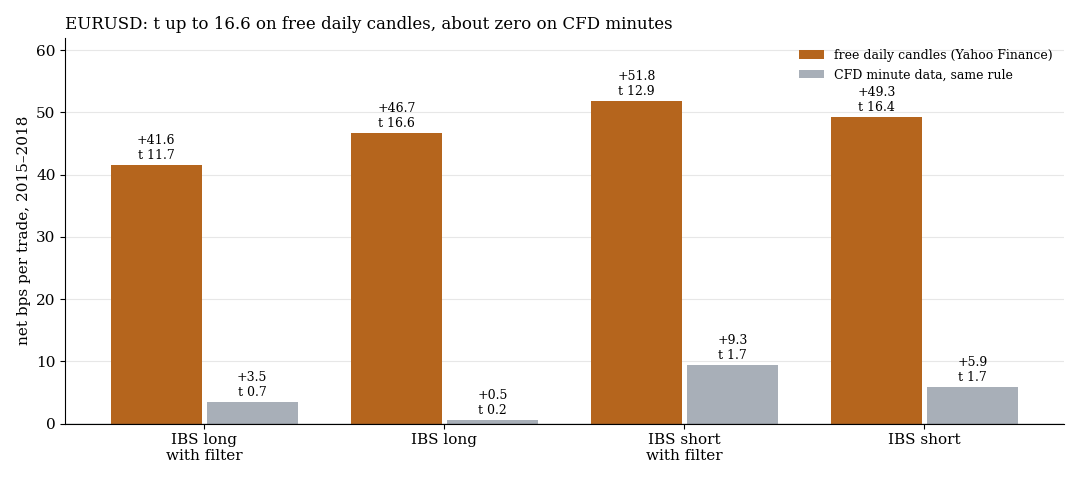
Same rule, same period 2015–2018: up to +52 bps per trade on free daily candles, +0.5 to +9 bps on CFD minute data and no t above 1.7.
The reason: in the free FX daily candles, close, high and low apparently do not come from the same time window. A rule that compares the close with the day's range then finds a pattern nobody can trade. Following an addendum fixed in advance, the EURUSD candidates were judged in the holdout on CFD data only. Five candidates dropped out, four because they were not positive on CFD data in 2015–2018, one for lack of CFD data. The primary rule was at +4.3 bps on CFD data 2015–2018 and at +6.2 bps on the daily candles: both positive, but small.
4. The holdout: 0 of 23
The holdout ran exactly once on 21 October 2026, for all 23 candidates together.
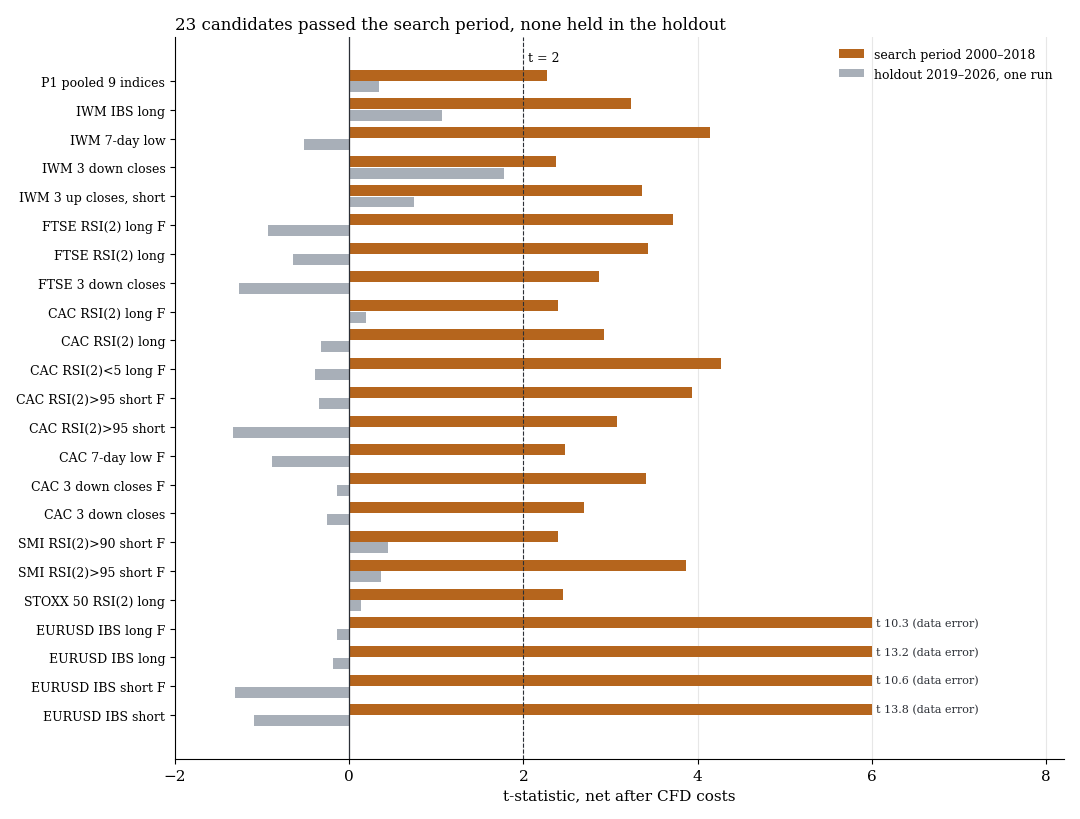
t-value per candidate, net after costs. Orange the search period, grey the single holdout. F = with trend filter. The EURUSD search-period values are the data error from section 3.
| Candidate | Holdout n | net bps | t |
|---|---|---|---|
| RSI(2) long with filter, nine indices | 503 | +6.49 | +0.34 |
| Russell 2000, three lower closes, filter | 58 | +26.90 | +1.78 |
| Russell 2000, IBS long | 396 | +8.34 | +1.06 |
| FTSE 100, RSI(2) long with filter | 56 | −21.35 | −0.93 |
| CAC 40, RSI(2) long without filter | 93 | −10.20 | −0.32 |
| EURUSD, IBS long (CFD 2023–2026) | 197 | −0.61 | −0.19 |
The primary rule earned +6.49 bps per trade in the holdout at t 0.34, and −5.2 bps on CFD data from 2023. No candidate reached the threshold locally; the best, three lower closes in the Russell 2000, was at t 1.78. The FTSE and most CAC cells, the strongest in the search period, were negative in the holdout. In the global correction across the programme's 105 holdout tests so far, the best q of this study is 0.26.
What it means
Buying pullbacks is not a general mechanism that can be transferred to any index. In the holdout it carries on the three large US indices and nowhere else. Whether that is due to the US market structure or whether the US indices were lucky cannot be separated with these data. For trading it means: do not extend the rule to other markets just because it looked good there in hindsight. The search period earned its results mainly in the years before 2015; from 2015 the effect was already small.
The second lesson concerns data. Free FX daily candles are not usable for rules that compare the closing price with the day's range. Without the check on CFD minutes, four data errors with t above 10 would have gone into the holdout.
Limits
- Entry at the close. For European and Asian indices the close is the auction price, which a CFD does not get exactly. With entry at the next open the result shrinks sharply even in the search period.
- Cost model. Spread, interest and dividends are approximations per market, not the conditions of a specific broker.
- Data. Yahoo Finance daily data are not checked against broker prices. CFD minute data only exist from 2015, and not at all for the Russell 2000 and Euro Stoxx 50.
- Small cells. Some candidates have only 14 to 31 trades in the holdout.
- Not tested: parameters other than the standard values, combinations of the rules, single stocks.
All pattern families and holdouts in the overview. Related: RSI(2) on US index CFDs, swing patterns after CFD financing and our workflow since October 2026.
📄 Full study as PDF: 9 pages incl. all tables, figures and limits (in German).
Disclaimer: Historical statistics are no guarantee of future market behaviour. This study is not investment advice. Trading carries a risk of loss up to total loss.