Data basis: Nasdaq 100, S&P 500 and Dow (cash session 09:30 to 16:00 New York), DAX (09:00 to 17:30 Berlin) and FTSE 100 (08:00 to 16:30 London), Dukascopy CFD minute data. Search period 2015–2022 with 141 triggers (DAX 39, Nasdaq 100 31, FTSE 25, S&P 500 24, Dow 22), holdout 2023–2026 with 56 triggers. Costs per round trip 2.5 (DAX), 1.5 (FTSE), 2.5 (Nasdaq 100), 0.8 (S&P 500) and 4.0 (Dow) index points, on average 2.4 bps (1 bp = 0.01%). Benchmarks: calm trend without acceleration on the same days (placebo), random markets, random direction. Pre-registered on 21 October 2026 before the first calculation (SHA-256 0fd80732…), addendum for the reversal variant on 23 October (19f7b3c8…). No trading recommendation.
A market rises quietly and evenly for an hour, then the move suddenly gets steeper. Many traders read this as rising momentum and jump in. The counter-argument: whoever buys now buys exhaustion, the steep phase is stops and short covering, and then the price turns. Both sides can be measured, and we measured both.
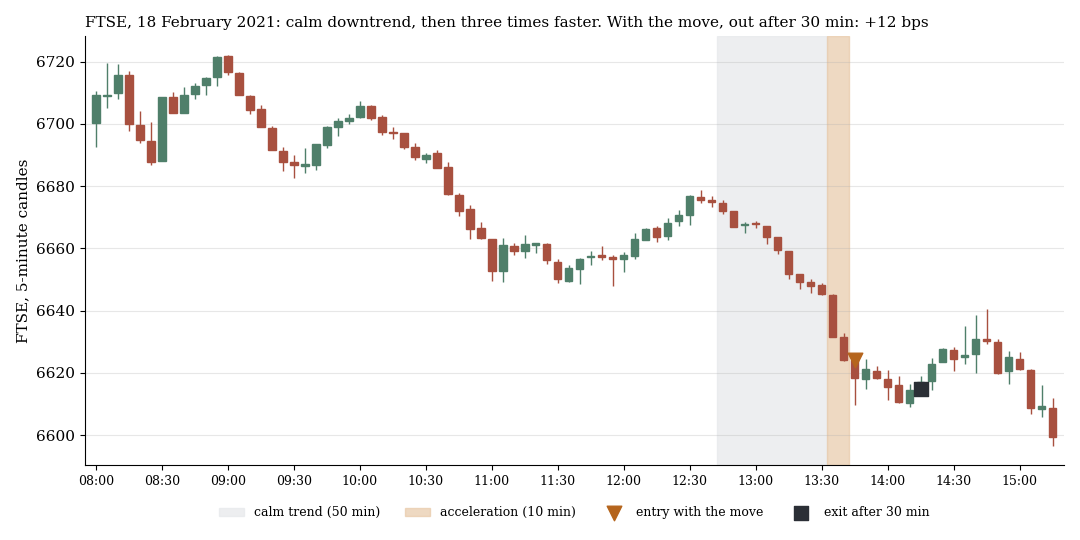
FTSE 100, 18 February 2021: after a calm downtrend (grey) the move becomes three times as fast within ten minutes (orange). Going along is +11.5 bps after costs after 30 minutes.
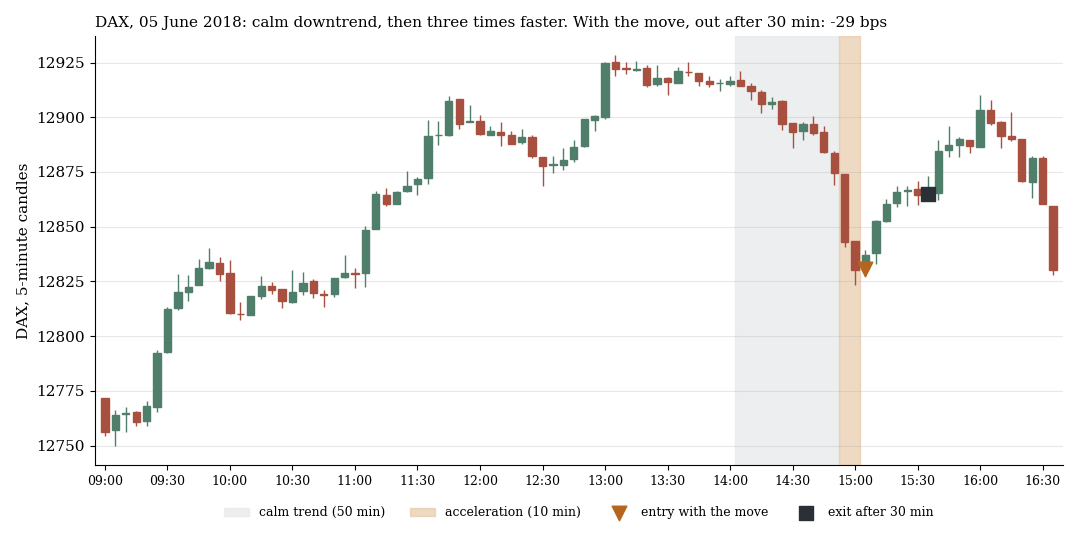
DAX, 5 June 2018: the same trigger, the price turns, −28.8 bps. Both cases were drawn at random with a fixed seed (7) from the triggers of the search period, one from the winners, one from the losers.
1. The rule
We check every five minutes, from 60 minutes after the open to 30 minutes before the close. The thresholds are our translation of “calm” and “steeper”, not optimised.
| Component | Definition |
|---|---|
| ATR | mean daily range of the previous 20 days |
| calm trend, 50 minutes | net move at least 0.25 ATR, efficiency (net move divided by the sum of all one-minute steps) at least 0.35 |
| total move, 60 minutes | at least 0.30 ATR in the same direction |
| acceleration, last 10 minutes | move at least three times the speed of the calm trend and the highest (lowest) close of the last 60 minutes |
| entry | open of the next minute, in the trend direction (downtrends mirrored) |
| exit | after 15, 30 or 60 minutes or at the last session minute |
The first trigger per market and day counts. The primary rule is going along with a 30-minute hold, pooled over the five markets, with cluster t by date and multiple-testing correction over four exits. The placebo is the first moment of the day with a calm trend but without acceleration: it separates the acceleration from the calm trend itself.
2. Search period: going along loses
| Exit | Going along net bps | t | before costs | Placebo net bps | t |
|---|---|---|---|---|---|
| 15 minutes | −6.78 | −2.67 | −4.37 | −1.76 | −5.43 |
| 30 minutes | −10.05 | −3.37 | −7.65 | −1.54 | −3.20 |
| 60 minutes | −7.35 | −1.62 | −4.95 | −1.02 | −1.56 |
| session end | −5.18 | −0.81 | −2.77 | +0.89 | +0.67 |
141 triggers, placebo about 5,000 days each, search period 2015–2022.
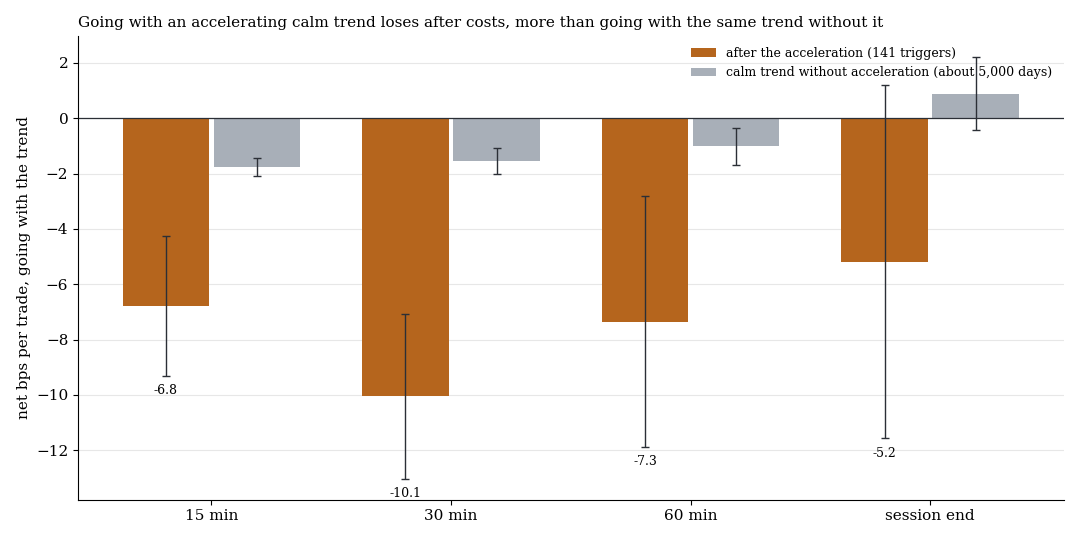
Net per trade, orange after the acceleration with one standard error, grey in a calm trend without acceleration.
The primary rule lost −10.05 bps (t −3.37, q 1.00): the gate was missed, by a wide margin in the wrong direction. On the same days the trigger was 14.24 bps below the placebo (t −4.98, 112 days). All five markets have the same sign: DAX −17.25 (t −3.59), Dow −12.63 (t −2.04), FTSE −8.27 (t −1.99), Nasdaq 100 −5.15 (t −0.95), S&P 500 −4.20 (t −0.75). On random markets the same rule came out at −0.30 and +0.08 bps, and for random direction the 95th percentile was +1.50. So the pattern is not a property of the calculation chain.
Part of the loss is costs: before costs it was −7.65 bps. The rest is real direction against the entrant.
3. The reversal: weakly positive in the search period
Whoever trades against the acceleration gets the same numbers with the opposite sign, only the costs stay.
| Exit | Reversal net bps | t | Placebo reversal net bps | t |
|---|---|---|---|---|
| 15 minutes | +1.96 | 0.76 | −3.08 | −9.56 |
| 30 minutes | +5.24 | 1.73 | −3.31 | −6.89 |
| 60 minutes | +2.54 | 0.55 | −3.83 | −5.85 |
| session end | +0.36 | 0.06 | −5.74 | −4.32 |
With 30 minutes, +5.24 bps (t 1.73, one-sided p 0.042), the reversal misses the threshold t ≥ 2. Against the placebo it is +14.35 bps (t 4.99). It was positive in six of the eight years, not in 2019 (−10.41) and 2022 (−1.99). It was carried by the DAX (+13.28, t 2.78) and the Dow (+9.30, t 1.49), not by the Nasdaq 100 (−1.58) and the S&P 500 (−1.29). With costs × 1.5, +4.04 bps (t 1.33) remained.
We chose the direction of the reversal only after looking at going along. A direction chosen after the fact must not pass the gate, and the reversal missed it as well (t 1.73). We ran it once in the holdout anyway, as a deliberate exception without a passed gate, with a locked addendum written before the calculation. The holdout is thereby used up for this question.
4. The holdout: −15.61 bps
| Exit | Reversal net bps | t |
|---|---|---|
| 15 minutes | −6.08 | −1.51 |
| 30 minutes | −15.61 | −1.58 |
| 60 minutes | −19.61 | −1.69 |
| session end | −29.63 | −1.94 |
56 triggers 2023–2026, placebo reversal −1.59 bps (t −2.91) at 30 minutes.
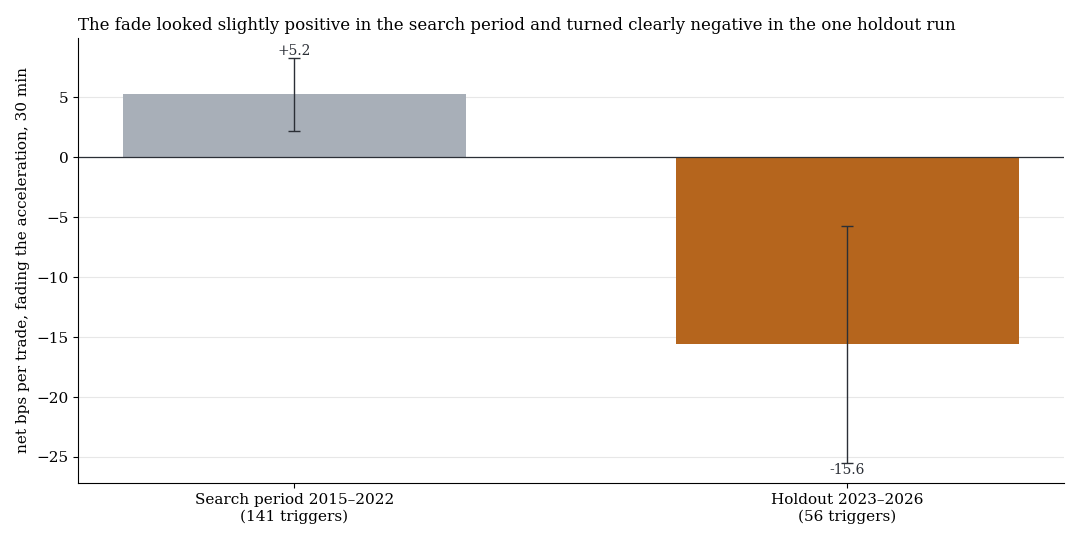
Net per trade, reversal with a 30-minute hold, one standard error. Grey the search period, orange the single holdout run.
In the holdout the reversal lost at every holding period, with 30 minutes −15.61 bps (t −1.58, one-sided p 0.94), with costs × 1.5 −16.30 bps (t −1.65). Against the placebo it was −8.52 bps (t −0.74). Four of the five markets were negative (Dow −42.86, Nasdaq 100 −17.38, S&P 500 −13.34, DAX −5.55), only the FTSE was slightly above at +1.82. Against the placebo all four years are negative. On random markets the same rule came out at +5.52 and −4.90 bps, the 95th percentile of random directions was +12.80 bps. Verdict: not confirmed, global correction q 1.00.
If you mirror the direction, going along is more likely positive in the holdout. We did not calculate that as a test and do not count it: it would be a second look at the same holdout with the opposite sign.
What it means
In the search period the acceleration after a calm intraday trend was not an entry signal but rather the end of the move. The pattern did not hold, though: what looked like a weak reversal in 2015–2022 turned around in 2023–2026. With about 15 triggers a year across all five markets (56 in just under four years) the holdout also has little power, its standard error is about 10 bps. In practice: neither enter because it gets steeper, nor bet against it.
Limits
- Thresholds chosen, not optimised. 0.25 and 0.30 ATR, efficiency 0.35 and the factor 3 are our translation. Other thresholds may come out differently.
- Few triggers. 141 in the search period, 56 in the holdout. Effects of a few bps cannot be separated.
- Direction chosen after the fact. The reversal was chosen after the going-along result. Its holdout is an exception without a passed gate and should be read as a cross-check only.
- Order book not measurable. The often-cited thin order book depth cannot be checked with CFD prices that carry no depth.
- Not tested: stop variants, holding periods beyond one day, single stocks, a test on high-volatility days only.
All pattern families and holdouts in the overview. Related: calm uptrends on a daily basis, the climax fade and intraday momentum after Gao et al..
📄 Full study as PDF: 7 pages incl. all tables, figures and limits (in German).
Disclaimer: Historical statistics are no guarantee of future market behaviour. This study is not investment advice. Trading carries a risk of loss up to total loss.