Data basis: Nasdaq 100, S&P 500, Dow, DAX and FTSE 100 (cash sessions), Dukascopy CFD minute data, search period 2015–2022. The holdout from 2023 stayed untouched because the gate was missed. Costs per round trip 2.5 (DAX), 1.5 (FTSE), 2.5 (Nasdaq 100), 0.8 (S&P 500) and 4.0 (Dow) index points, on average about 2.5 bps (1 bp = 0.01%). Benchmarks: stretched days without an accelerating end (placebo), random markets. Pre-registered on 21 October 2026 before the first calculation (SHA-256 775156d4…). No trading recommendation.
“The climax is more likely the end of the move.” When an index has run far during the day and the last stretch accelerated once more, many traders bet on the reversal, immediately or at the first reversal signal. That fits our intraday measurement of acceleration, which had shown a short-term reversal in the search period. Here we test the climax version.
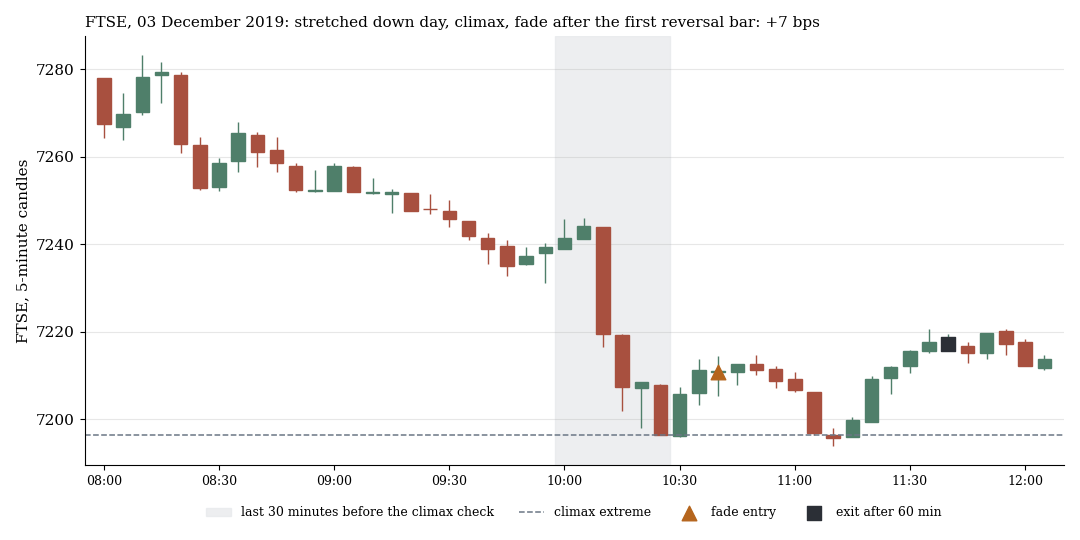
FTSE 100, 3 December 2019: the day is more than one ATR below the open, the low came accelerated. Long after the first reversal bar, +6.8 bps after costs after 60 minutes. The dashed line is the climax low.
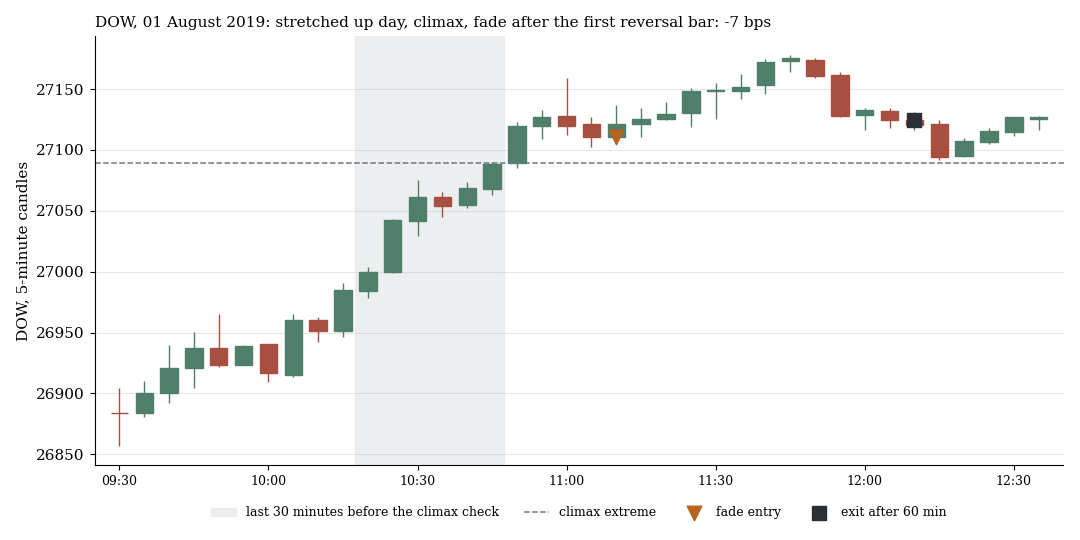
Dow, 1 August 2019: same rule, −6.6 bps. Both cases were drawn at random with a fixed seed (7) from the cases of the primary rule in the search period.
1. The rule
We check every five minutes, from 30 minutes after the open to 60 minutes before the close. A climax exists when the move since the open is at least k ATR (k = 1.0 or 1.5, ATR = mean daily range of the previous 20 days), price stands at the session extreme and the last 30 minutes make up at least half of the day's move. The first climax per market and day counts.
| Variant | Entry against the move | Exit |
|---|---|---|
| V0 immediate | at the open of the next minute | 30 or 60 minutes later or at the close, no stop |
| V1 after reversal signal | after the first 5-minute bar within 60 minutes that closes beyond the extreme of the previous bar against the move | as V0 |
Two thresholds, two entries, three exits: 12 tests with multiple-testing correction. Primary: k 1.0, V1, 60 minutes, pooled over the five markets. The placebo is stretched days without an accelerating end, with the same entry and exit.
2. Result
| Variant | Climax n | 30 min net bps | 60 min net bps (t) | Close net bps (t) | Placebo 60 min | Extreme exceeded |
|---|---|---|---|---|---|---|
| k 1.0, immediate | 227 | +1.29 | +3.63 (0.63) | +16.96 (1.30) | −1.84 | 94% |
| k 1.0, after reversal | 217 | −7.80 | −4.36 (−0.95) | +11.12 (0.87) | −3.26 | 76% |
| k 1.5, immediate | 47 | +15.20 | +15.89 (1.21) | +16.70 (0.80) | +3.09 | 91% |
| k 1.5, after reversal | 46 | −2.21 | +4.63 (0.53) | −0.46 (−0.03) | +0.73 | 70% |
Net bps per trade after costs, search period 2015–2022. “Extreme exceeded”: share of trades in which the price still exceeded the climax high (low) afterwards until the end of the session.
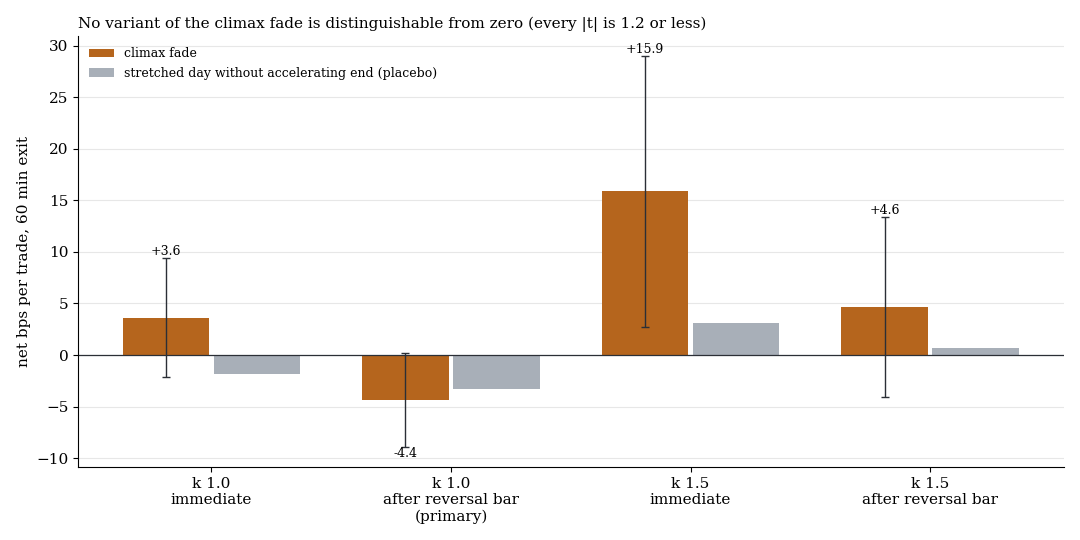
Net per trade, 60 minutes, orange the climax fade with one standard error, grey the placebo (stretched day without an accelerating end).
The primary rule earned −4.36 bps (t −0.95, q 0.91), the placebo was at −3.26: the climax does not differ from an ordinary stretched day. By market the primary rule ranges from −9.44 (Nasdaq 100, t −1.24) to +3.84 bps (Dow, t 0.58), no market with |t| above 1.3. The largest values sit in the rare cases with k 1.5 and immediate entry (+15.2 to +16.7 bps, 47 cases, t 0.8 to 1.2), the placebo there is at +0.7 to +3.1. On two random markets the primary rule came out at +3.16 and +9.24 bps, on average above the result on real data. No test passed the gate, so there was no holdout run.
3. The extreme is rarely the extreme
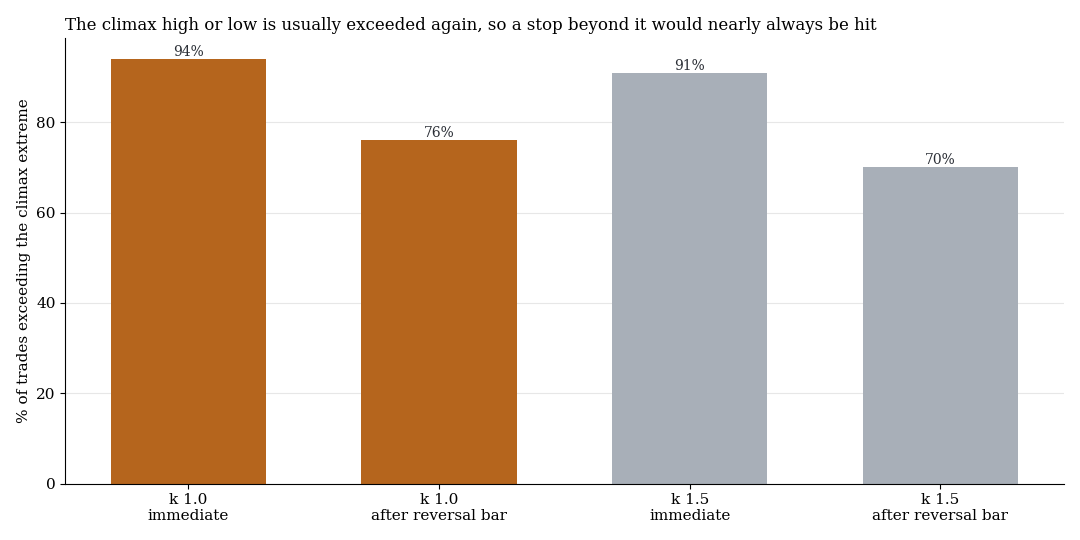
Share of cases in which the price still exceeded the climax extreme after entry, until the end of the session.
Whoever trades against the climax would sensibly put the stop beyond the extreme. That stop would have been hit in 94% of the immediate entries and in 76% of the entries after the first reversal signal (k 1.0). With k 1.5 it is 91% and 70%. The climax is mostly an interim extreme, and the confirmation bar comes too late to change that.
What it means
The climax fade is on average no edge. The mix of stretched and accelerated is no different event from a stretched day, and after costs nothing is left. Together with the intraday measurement of acceleration the picture is: accelerations turn by a few bps at most, which is too little after costs.
Limits
- Thresholds chosen. k of 1.0 and 1.5, half of the day's move and the 30 minutes are our translation of “climax”, not optimised.
- No stop. All exits are time exits. Stop variants would be separate tests, and with 76 to 94% of extremes exceeded a tight stop makes little sense.
- Small cells. With k 1.5 only 46 and 47 cases across five markets.
- Not tested: other reversal signals, holding periods beyond the day, single stocks and futures with real volume.
All pattern families and holdouts in the overview. Related: measurement after a calm trend, time of day and calendar effects intraday and VWAP and indicators intraday.
📄 Full study as PDF: 6 pages incl. all tables, figures and limits (in German).
Disclaimer: Historical statistics are no guarantee of future market behaviour. This study is not investment advice. Trading carries a risk of loss up to total loss.