Data basis: Nasdaq 100, S&P 500 and Dow (cash session 09:30 to 16:00 New York), Dukascopy CFD minute data, 385 to 386 Fridays per market in the 2015–2022 search period. The holdout from 2023 stayed untouched because the gate was missed. Costs per round trip 2.5 (Nasdaq 100), 0.8 (S&P 500) and 4.0 (Dow) index points. Benchmarks: Friday long from the open with the same weekly filter, a random entry minute on the same day (95th percentile), two random markets. Pre-registered on 23 October 2026 before the first calculation (SHA-256 d62b26be…). No trading recommendation.
The idea comes from practice: the week was weak, with RSI pullbacks, a bearish EMA cross or a sell-off of more than an ATR. On Friday the price briefly drops below the weekly low, wins it back, and then it climbs to the close. A liquidity sweep with a rebound, the moment when the stops below the low have been collected.
We turned this into a rule and separated two questions: does the sweep add anything? And does a weak week alone bring a Friday rebound?
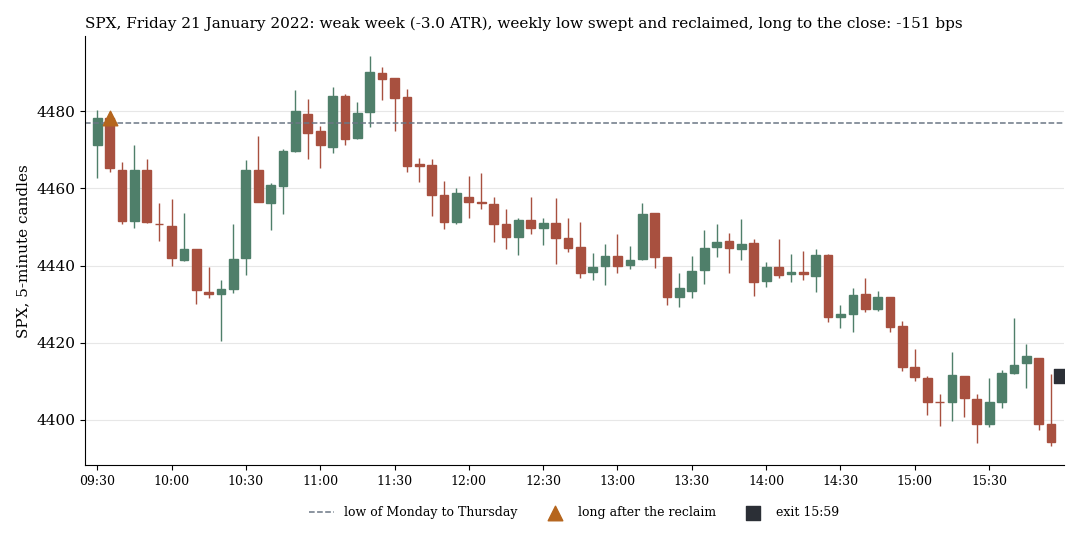
S&P 500, Friday 21 January 2022: the week is 3.0 ATR down, the price breaks the weekly low right at the open and wins it back. Long to 15:59, −151.0 bps after costs.
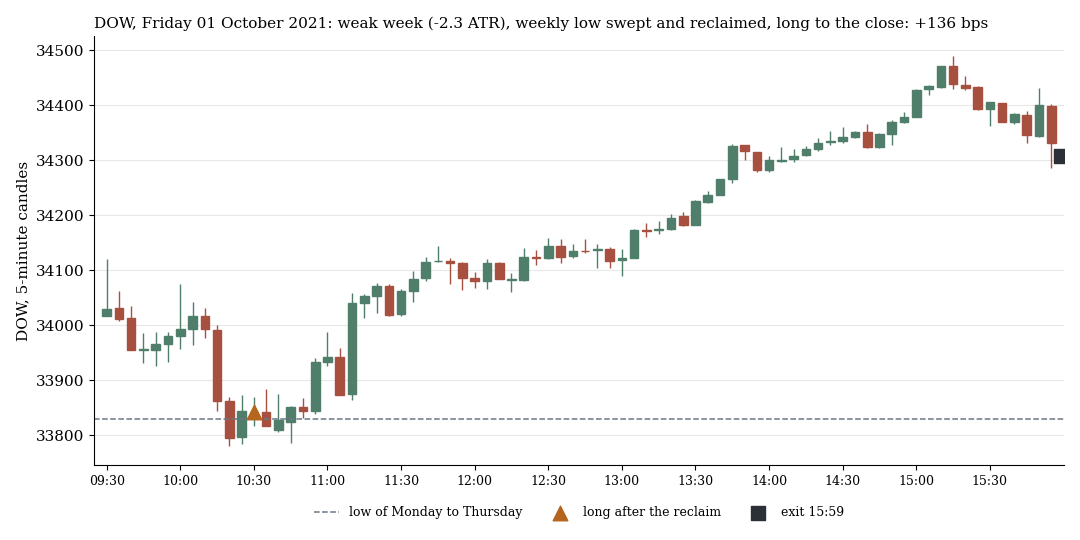
Dow, Friday 1 October 2021: same rule, +136.5 bps. Both Fridays were drawn at random with a fixed seed (7) from the trigger cases of the primary rule in the search period, one from the winners, one from the losers.
1. The rule
| Component | Definition |
|---|---|
| Week | Monday to Thursday of the same calendar week (at least three sessions), reference is the close before the first of these sessions |
| Weak-week filter (known at Thursday's close) | W1 (primary): weekly change at most −1.0 ATR; W2: RSI(2) of the daily closes below 10; W3: EMA(9) below EMA(21) and close below EMA(21); W0: no filter |
| Sweep level | WL (primary): lowest low from Monday to Thursday; PDL: low of Thursday |
| Trigger on Friday | price breaks the level, then the first 5-minute candle closes back above it |
| Entry, exit | long at the open of the minute after the candle, only until 15:00, exit 15:59 |
ATR is the mean daily range of the previous 20 days. Four filters times two levels give eight tests, pooled across the three markets (cluster t by date), with multiple-testing correction. Primary: W1 with WL. Gate: net t ≥ 2, q ≤ 0.10, the sweep must be better than the entry at the open and above the 95th percentile of a random minute.
2. Result: eight cells, none carries
| Filter | Level | n | net bps | t | Sweep rate | Friday long from 09:31 (n, net bps, t) |
|---|---|---|---|---|---|---|
| none | week | 202 | −5.54 | −0.63 | 17% | 1,156, −5.34, −1.17 |
| none | Thursday | 363 | +1.29 | 0.19 | 31% | as above |
| week at least 1 ATR down | week | 71 | +1.67 | 0.09 | 33% | 218, −17.74, −1.32 |
| week at least 1 ATR down | Thursday | 72 | +5.71 | 0.30 | 33% | as above |
| RSI(2) below 10 | week | 42 | −17.63 | −0.63 | 43% | 97, −28.25, −1.56 |
| RSI(2) below 10 | Thursday | 45 | −5.14 | −0.18 | 46% | as above |
| EMA9 below EMA21 | week | 77 | −0.98 | −0.05 | 26% | 293, −12.28, −0.91 |
| EMA9 below EMA21 | Thursday | 105 | +0.43 | 0.02 | 36% | as above |
Net bps per trade after costs, search period 2015–2022. The primary rule is in bold. Sweep rate: share of Fridays with a trigger.
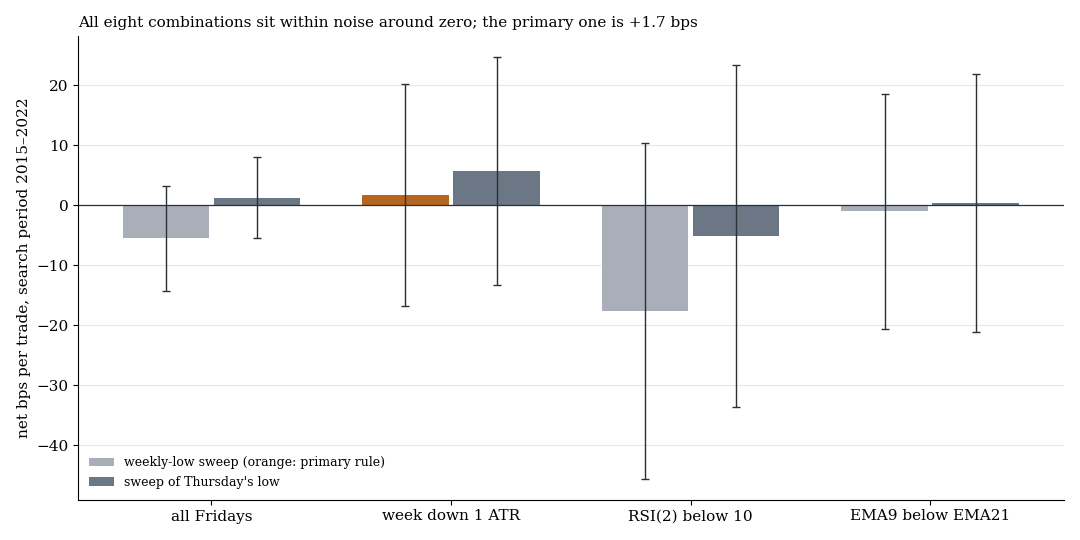
Net per trade with one standard error, grey the weekly low, blue Thursday's low as the level, orange the primary rule.
The primary rule earned +1.67 bps (t 0.09, one-sided p 0.47, q 0.74). By market: Dow +0.48, Nasdaq 100 +0.61, S&P 500 +3.87 bps, all at |t| below 0.3. A random entry minute on the same days reached +5.63 bps at the 95th percentile, the rule is below it. On two random markets the same rule came out at −3.72 and +3.67 bps. The years jump: 2015, 2016, 2018 and 2022 negative, 2019 to 2021 positive, with 6 to 15 trades per listed year.
3. No Friday rebound after a weak week
The simpler question first: whoever buys the Friday open after a weak week without waiting for a sweep gets −17.74 bps (W1, t −1.32), −28.25 bps (RSI(2), t −1.56) and −12.28 bps (EMA, t −0.91). On an arbitrary Friday it is −5.34 bps (t −1.17). A weak week thus does not announce a rebound, rather a continuation of the weakness, if without significance.
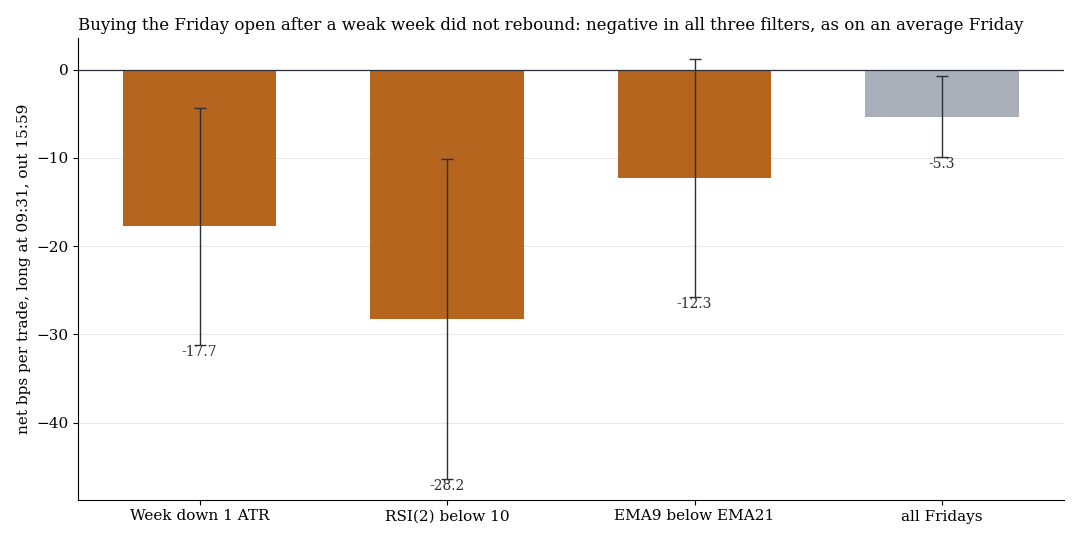
Net per trade, entry 09:31, exit 15:59, in the three filters against all Fridays.
Why +62.6 bps is no evidence
If you compare the rule on the trigger days pairwise with the entry at 09:31 on the same day, +62.64 bps come out (t 4.23). That looks like a clear edge of the sweep timing. It is a selection error: trigger days are by definition days on which the price first broke below the weekly low after 09:31. The entry at 09:31 on those days comes before the drop and is therefore a bad moment already through the selection. The fair comparison is the random minute on the same day, and against it the rule at +1.67 bps is below the 95th percentile of +5.63.
What it means
Neither the sweep of the weekly low nor the weak week itself delivers an edge on Fridays. The three US indices are highly correlated, so the 71 trades are not 71 independent observations but fewer. The result fits our earlier measurements: sweeps alone were already dead in the first scan (holdout +0.8 bps), and the RSI(2) pullback works on a daily basis, not as a Friday day trade.
Limits
- Few trades. 71 in the primary rule (about 20 to 25 per market), the RSI(2) cells only 42 and 45. The standard error of the primary rule is about 19 bps (from mean and t), small effects stay invisible.
- Thresholds chosen. One ATR down, RSI(2) below 10 and the EMA lengths 9 and 21 are standard values, not optimised.
- Highly correlated markets. Clustering by date accounts for that but widens the standard error.
- Holdout not run because the gate was missed. 2023–2026 stayed untouched.
- Not tested: other weekdays, the short side after a strong week, other markets, holding periods beyond the day.
All pattern families and holdouts in the overview. Related: Smart Money Concepts tested, time of day and calendar effects intraday and RSI(2) on US index CFDs.
📄 Full study as PDF: 7 pages incl. all tables, figures and limits (in German).
Disclaimer: Historical statistics are no guarantee of future market behaviour. This study is not investment advice. Trading carries a risk of loss up to total loss.