Data basis: DAX, FTSE 100, S&P 500 and Nasdaq 100, Dukascopy CFD minute data, cash session, search period 2015–2022 for the trading rules. The holdout from 2023 stayed untouched because the gate was missed. Costs per round trip as in every study of this series. Benchmarks: entering at once when the trend state appears, a random entry minute on the same day, two random markets. Pre-registered on 2 November 2026 (SHA-256 da0fcb3b…, the other side as an amendment 5b0993eb… before it was calculated). The touch count of 5 November 2026 is descriptive and covers Nasdaq 100, S&P 500 and DAX from 2015 to June 2026. No trading recommendation.
The TWAP is the time-weighted average price of the running session. On trend days the first pullback to this average is seen as a good re-entry: the trend is confirmed, the price is better than at the breakout. The opposite view says the trend day turns at the TWAP. And a third, widespread rule concerns the number of touches: the first one holds, the second one breaks.
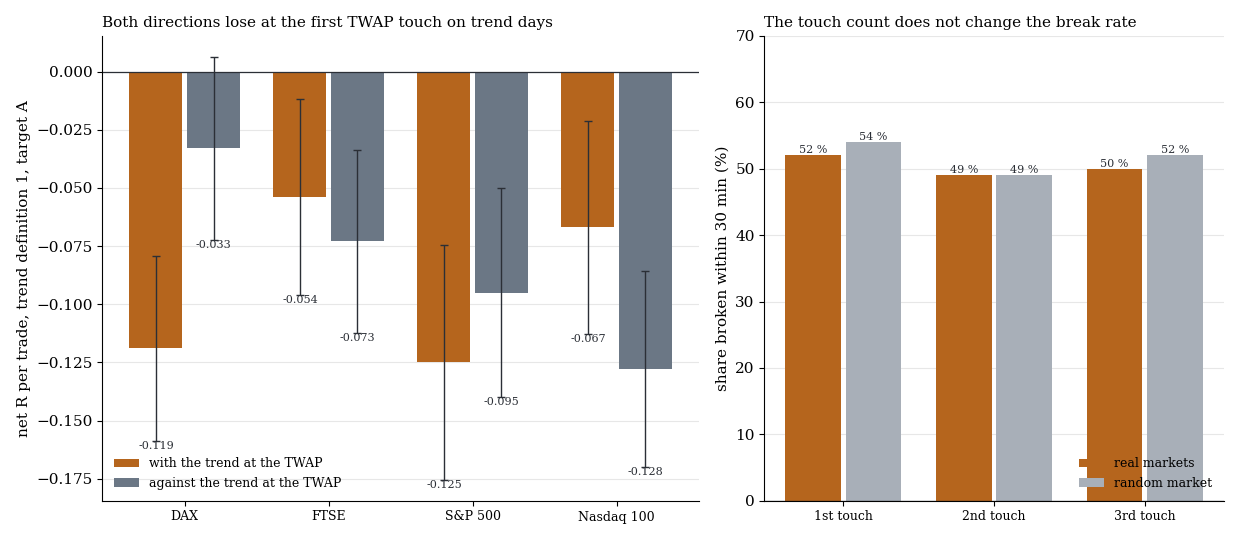
Left net per trade in R by market, with the trend (orange) and against the trend (blue) at the first TWAP touch, trend definition 1, target A. Right the share of touches that break within 30 minutes, real against random market.
1. The rules
| Component | Definition |
|---|---|
| Trend state T1 | at least 85 % of minutes on one side of the TWAP and distance from open to price at least 0.5 daily ATR |
| Trend state T2 | new session extreme within the last 30 minutes, at least 0.6 daily ATR from the open |
| Check time | 90 to 420 minutes after the open |
| Entry | limit at the TWAP on the first touch after the trend state |
| Risk | stop 0.3 daily ATR, target A the session extreme so far, target B 1 R, otherwise exit before the close |
| Other side | same touch, direction against the trend, target 1 R or the session open |
Primary: DAX, T1, target A. 18 cells per direction, multiple-testing correction, gate net t ≥ 2 and better than entering at once and than the random market.
2. Result
| Cell (target A) | n | with the trend R (t) | against the trend R (t) | at once | Random market 1 / 2 |
|---|---|---|---|---|---|
| DAX T1 | 543 | −0.119 (−2.99) | −0.033 (−0.84) | −0.008 | −0.057 / −0.004 |
| DAX T2 | 538 | −0.136 (−3.20) | −0.030 (−0.77) | −0.044 | −0.071 / −0.010 |
| FTSE T1 | 539 | −0.054 (−1.28) | −0.073 (−1.85) | −0.087 | |
| S&P 500 T1 | 426 | −0.125 (−2.48) | −0.095 (−2.12) | −0.120 | |
| Nasdaq 100 T1 | 462 | −0.067 (−1.46) | −0.128 (−3.04) | −0.100 | |
| pooled T1 | 1,970 | −0.090 (−3.55) | −0.080 (−3.45) | −0.092 / −0.049 | |
| pooled T2 | 1,981 | −0.084 (−3.16) | −0.102 (−4.43) | −0.118 / −0.043 |
Search period 2015–2022, net after costs. Column “at once”: entry with the trend right when the trend state appears. Random market values for the direction with the trend.
All 18 cells with the trend are negative, in the DAX in each of the eight years. The TWAP is touched on 58 to 70 % of trend days, a median of 55 to 107 minutes after the trend state. Only 42 to 51 % of the trades then reach the old session extreme. The pullback is often already the end of the trend. Waiting for it leaves you worse off in the DAX than entering at once (Welch t −2.48). The other side gains nothing from that: all 18 cells against the trend are negative as well, with hit rates of 41 to 51 %. The random market delivers the same orders of magnitude. What remains is cost and stop mechanics.
3. The first touch holds, the second breaks?
A touch counts when the price comes onto the TWAP from at least 0.15 daily ATR away. A break means a 5-minute close at least 0.05 ATR beyond the TWAP within 30 minutes.
| Touch | n real | breaks real | breaks random market | follow-through after break real / random |
|---|---|---|---|---|
| 1st | 14,149 | 52 % | 54 % | 30 % / 30 % |
| 2nd | 3,034 | 49 % | 49 % | 27 % / 28 % |
| 3rd | 561 | 50 % | 52 % | 29 % / 30 % |
17,858 touches on 2,855 days, Nasdaq 100, S&P 500 and DAX pooled. Follow-through: the break keeps running instead of being won back.
The break rate is close to 50 % at every touch, and the random market shows the same values. After a break the price keeps running in 29 % of cases (random 30 %), the TWAP is won back in 36 to 37 %. By market, and early against late in the day, the picture does not change.
What this means
The TWAP on trend days is not a level with a direction, neither as an entry with the trend nor against it, and the number of touches says nothing about whether it holds. This fits our measurements of VWAP and indicators and of the EMA9 and VWAP cross.
Limits
- Two trend definitions. Other definitions of trend days can give other sets.
- Fixed stops. 0.3 daily ATR was not varied, tighter or wider stops are not tested.
- Touch count descriptive. It runs over the search period and later years together, without a trading rule and without costs.
- Holdout not run, because the gate was missed. 2023–2026 stayed untouched for the trading rules.
All pattern families and holdouts in the overview. Related: Climax fade intraday.
📄 Full study as PDF: 6 pages incl. all tables, figures and limits (in German).
Disclaimer: Historical statistics are no guarantee of future market behaviour. This study is not investment advice. Trading carries a risk of loss up to total loss.