Data basis: DAX, Nasdaq 100, S&P 500, Dow and gold, Dukascopy CFD minute data as 5-minute candles. Decision point every full and half hour of the cash session (gold: 03:00 to 16:00 New York). Search period 2015–2022, models estimated walk-forward each year, evaluated 2017–2022: 84,689 decision points at the two-hour horizon. The holdout from 2023 stayed untouched because the gate was missed. Costs per round trip as in every study of this series. Benchmarks: “the regime stays”, “always range” and two random markets. Pre-registered on 16 November 2026 (SHA-256 7a3273fb…). No trading recommendation.
The idea is old and plausible: in trend phases you follow the move and let profits run, in sideways phases you trade against it and take profits early. There are dozens of indicators for this, from ADX and efficiency ratio to the choppiness index. All of them describe what the last hours were like. But what has to be traded are the next ones. So this study asks only one question: does the regime of the last one to three hours predict that of the next one to three hours?
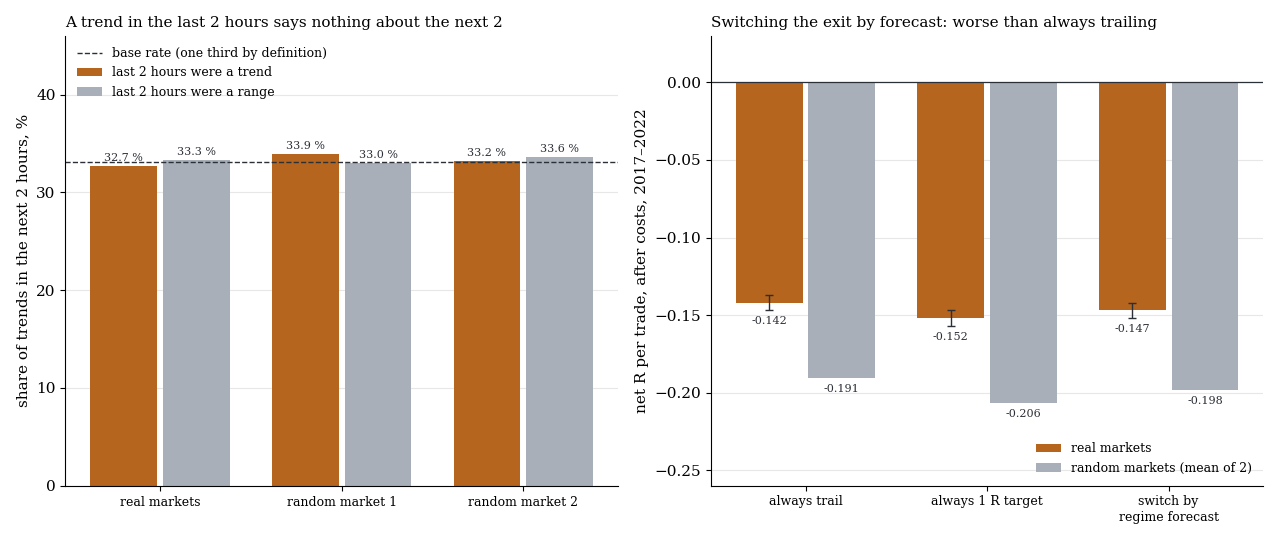
Left the share of trend windows in the next two hours, split by whether the last two hours were a trend or a range, real and on two random markets. Right the result per trade after costs for three exits, with one standard error.
1. The measurement
| Building block | Definition |
|---|---|
| Regime | efficiency ratio of the window: absolute net move divided by the sum of all 5-minute moves |
| Trend | efficiency ratio in the top third of all windows of the same market and horizon, otherwise range |
| Horizon | the next 60, 120 or 180 minutes, primary 120 |
| Features | efficiency ratio over 60, 120 and 180 minutes, variance ratio, autocorrelation, ADX(14), range against daily ATR, volatility ratio, efficiency ratio and position within the session, three features of the prior day, time of day |
| Models | logistic regression (primary) and gradient boosting, each year estimated only from the years before |
| Benefit | entry in the direction of the last 60 minutes, stop 1 R; exit by trailing stop, by a fixed target at 1 R, or depending on the forecast |
We measure the quality of a probability forecast with the Brier score, the mean squared distance between forecast and outcome. Smaller is better. The comparison runs against the simplest rule a regime detector has to beat: the regime of the last two hours stays.
The gate: the model has to beat this rule with t ≥ 2, the same must not succeed on the random markets, and the exit chosen by forecast has to be better net than the better fixed exit.
2. Result: gate missed on all three points
| Horizon 2 hours, 5 markets | real | random market 1 | random market 2 |
|---|---|---|---|
| Trend in the next 2 h after a trend | 32.7 % | 33.9 % | 33.2 % |
| Trend in the next 2 h after a range | 33.3 % | 33.0 % | 33.6 % |
| Brier score “the regime stays” | 0.2217 | 0.2222 | 0.2227 |
| Brier score model | 0.2221 | 0.2227 | 0.2232 |
| Advantage of the model | −0.0004 (t −2.9) | −0.0005 (t −4.6) | −0.0005 (t −4.4) |
| Hit rate model / “always range” | 66.9 % / 66.9 % | 66.7 % / 66.7 % | 66.6 % / 66.6 % |
| Trend rate in the lowest / highest tenth of the forecast | 32.0 % / 34.1 % | 33.0 % / 32.9 % | 33.1 % / 33.1 % |
n 84,689 decision points, 2017–2022, standard errors clustered by date.
The regime has no memory. After two hours of trend, a trend follows again in 32.7 % of cases, after two hours of range in 33.3 %. Both are the base rate of one third.
The 15 features find something, but it is tiny: between the lowest and the highest tenth of the forecast the trend rate rises from 32 to 34 %. On the random markets this difference does not exist, so it is real. As a forecast the model is still worse than the simple rule because it also learns noise. Its hit rate equals that of “always range”. Gradient boosting is worse still (t −8.0). At 60 and 180 minutes and in each of the five markets alone the sign is the same.
3. The exit by regime
| Per trade after costs | real | random market 1 | random market 2 |
|---|---|---|---|
| always trailing stop | −0.142 R (t −30.5) | −0.194 R | −0.187 R |
| always fixed target 1 R | −0.152 R (t −30.5) | −0.207 R | −0.206 R |
| exit by forecast | −0.147 R (t −30.8) | −0.200 R | −0.196 R |
| forecast minus trailing stop | −0.005 R (t −2.7) | −0.006 R (t −3.6) | −0.010 R (t −6.0) |
84,509 trades, costs about 0.16 R per trade.
The trailing stop beats the fixed target in every market, real as on the random markets. That is mechanics of the exit and has nothing to do with the regime. Switching by forecast takes half of the trades away from the better exit without being able to separate trend and range, and loses by doing so. Choosing the direction by the forecast as well, with the move in a trend and against it in a range, brings nothing (+0.012 R against the better fixed direction, t 1.0).
4. What can be predicted: the size
As a second target we had called a window a “trend” when it closes at the edge of its range and the range is large. The model predicts this target clearly: the rate rises from the lowest to the highest tenth from 7.5 to 38.2 % (t 18.1). On the random markets it rises from 8.0 to 41.0 % and from 8.3 to 41.5 %. The random markets have no direction by construction but keep the sequence of calm and restless phases. So what can be predicted is whether a lot will move in the next two hours, not whether it will run in one direction. How well this size can be forecast is shown in the study on the range forecast.
What this means
An indicator that classifies the last hours as trend or range describes the past correctly and says nothing about the next hours. As a switch between trend following and fading, or between two exits, it does not work on this time scale. This fits our measurements of volatility as a regime: the size can be forecast, the direction cannot.
Limits
- One definition of trend. The efficiency ratio is one measure among several. The class boundary comes from the whole search period.
- Short time scale. Regimes over days or weeks, after macro events, or from market breadth are not tested.
- Simple models. A linear regression and a shallow boosting, without order book and options data.
- Overlapping windows. Up to 14 decision points per day and market, for gold up to 22, depend on each other. The standard errors are clustered by date, which does not capture dependence across several days.
- The entry is a measuring frame. The rule “in the direction of the last 60 minutes” only serves to measure the benefit of the forecast.
- Holdout not run, because the gate was missed.
All pattern families and holdouts in the overview. Related: trend days need no catalyst.
📄 Full study as PDF: 6 pages incl. all tables, figures and limits (in German).
Disclaimer: Historical statistics are no guarantee of future market behaviour. This study is not investment advice. Trading carries a risk of loss up to total loss.