Data basis: DAX, FTSE 100, Nasdaq 100, S&P 500, Dow, gold and EURUSD, Dukascopy minute data, all times of day, also outside the cash session. Forecast time every full and half hour. Search period 2015–2022, evaluated walk-forward 2017–2022 (each year with coefficients from the years before): 423,242 forecasts. Holdout January 2023 to June 2026, a single run with the coefficients from 2015–2022: 257,080 forecasts. Standard errors clustered by date. Model, benchmark forecasts and gate were fixed before the first calculation (registered on 16 November 2026, SHA-256 3b7109e2…). No trading rule, no costs. No trading recommendation.
Our test of a trend and range detector from the same day ended with a no: whether the next hours will run in one direction cannot be read from the last ones. What stood out was what can be predicted instead, namely how much the market moves. This study checks how well a simple formula hits the high-low range of the next one to two hours, against the reference values used in practice: what is usual for the time of day, the last hours, and the daily ATR.
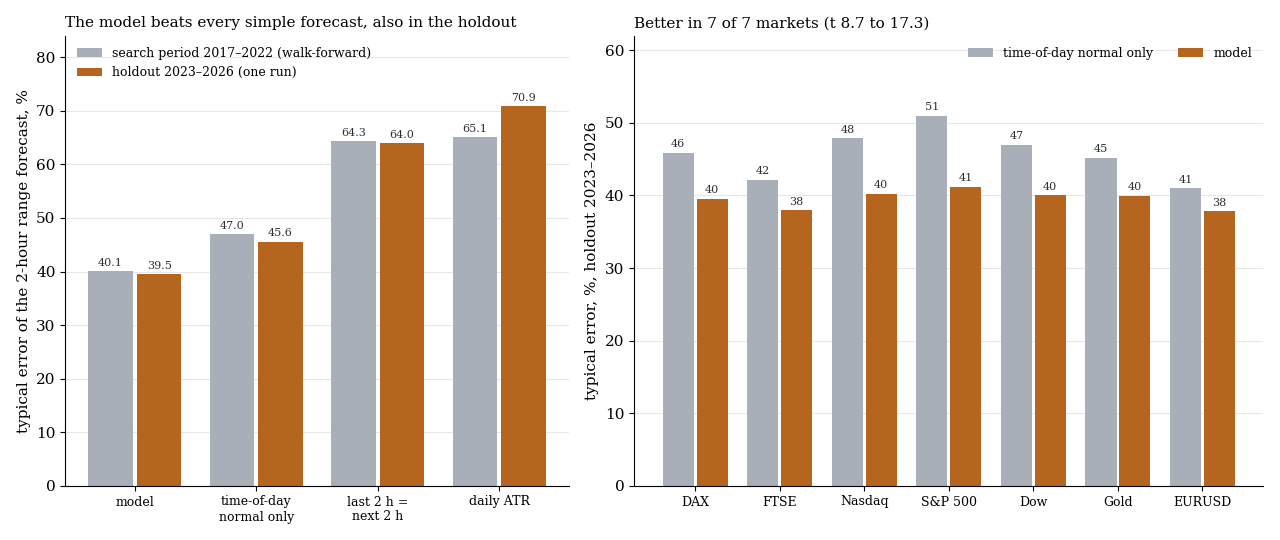
Left the typical error of the two-hour forecast by method, search period (grey) and holdout (orange), all seven markets together. Right the holdout by market: time-of-day normal alone against the model.
1. The model
The forecast has three building blocks and one set of coefficients for all markets:
| Building block | Definition |
|---|---|
| Time-of-day normal | median range of the same two-hour window on the last 20 valid days |
| Activity 2 h | range of the last 2 hours, divided by its own time-of-day normal |
| Activity 6 h | range of the last 6 hours, divided by its own time-of-day normal |
| Formula | forecast = time-of-day normal × (activity 2 h)^0.30 × (activity 6 h)^0.24 × 1.006 |
The exponents come from a linear regression of the log ranges on 2015–2022. They say the decisive thing: if the market was twice as active as usual in the last two hours, the model expects a good 20 % more than usual for the next two hours, not twice as much. An estimate per market was no better than the joint one.
The comparison runs against three simple forecasts, each with the same walk-forward estimation and its own constant: the time-of-day normal alone, “the next two hours will be like the last two”, and the mean daily range of the last 20 days (daily ATR).
The typical error is the mean absolute log deviation, converted back to percent. 40 % means: the actual range is on average a factor of 1.4 above or below the forecast.
2. Result
| Period | n | Model | time of day only | last 2 h | daily ATR | model vs time of day | 80 % band hits |
|---|---|---|---|---|---|---|---|
| Search period 2017–2022 | 423,242 | 40.1 % | 47.0 % | 64.3 % | 65.1 % | t 24.7 | 80.5 % |
| Holdout 2023–2026 | 257,080 | 39.5 % | 45.6 % | 64.0 % | 70.9 % | t 16.9 | 80.7 % |
Typical error of the two-hour forecast, seven markets pooled. The 80 % band runs from 0.59 times to 1.74 times the forecast, its bounds come from the search period.
Both gates fixed in advance are passed. In the search period the model beats all three benchmark forecasts (against the last two hours t 91.5, against the daily ATR t 85.9) and is better than the time-of-day normal in 7 of 7 markets. In the holdout the distance to the time-of-day normal stays almost the same, and the band hits 80.7 % instead of the intended 80 %.
| Market (holdout) | n | Model | time of day only | t |
|---|---|---|---|---|
| DAX | 35,229 | 39.6 % | 45.9 % | 13.5 |
| FTSE 100 | 35,246 | 38.0 % | 42.2 % | 9.8 |
| Nasdaq 100 | 34,995 | 40.2 % | 47.9 % | 15.2 |
| S&P 500 | 35,343 | 41.2 % | 51.0 % | 17.3 |
| Dow | 35,378 | 40.0 % | 47.0 % | 14.3 |
| Gold | 39,921 | 40.0 % | 45.2 % | 11.0 |
| EURUSD | 40,968 | 37.8 % | 41.0 % | 8.7 |
The model gains most in the US indices and least in EURUSD and gold. For the one-hour forecast the picture is the same: in the holdout 39.4 % against 46.3 % (t 18.5).
3. What is surprising about it
The last two hours are a poor forecast. “It will go on the way it is going now” is, at 64 % error, far behind the time-of-day normal at 46 to 47 %. The reason is the daily profile: a quiet midday hour says little about the hour after the US open, which is large on almost every day. Extending the last range ignores exactly that.
The daily ATR is even worse. It knows neither the time of day nor the current day. In the holdout its error is 71 %.
The core is the time of day. The model improves the time-of-day normal by about six percentage points. That is statistically clear, but in size a moderate gain. The largest step is the one from the ATR or the last range to the time-of-day normal, and anyone can take it without a regression.
What this means
The size of the next one to two hours can be predicted, the direction cannot. That is useful for everything that depends on the expected fluctuation: whether a stop distance fits the time of day, how large a position may be, whether a target is realistic in the time left. As a basis for this, what is usual for the time of day is the better choice than the daily ATR, and recent activity shifts that value only in a damped way. The same pattern already showed at the daily level, where VIX term structure and gamma predict the range but not the direction.
Limits
- Rough order of magnitude. A typical error of 40 % and a band from 0.6 times to 1.7 times are not a point forecast.
- No scheduled events in the model. In hours with inflation data, the jobs report or a rate decision the forecast understates the range.
- No trading benefit tested. Whether stops or position sizes set by this forecast lead to better results, we have not measured.
- Dukascopy prices. With another broker the ranges differ slightly. The test ran on a 30-minute grid.
- Holdout only for the main comparison. The holdout gate concerned model against time-of-day normal and the band coverage. The other holdout figures come from the same run and are descriptive.
All pattern families and holdouts in the overview. Related: time-of-day and calendar effects.
📄 Full study as PDF: 7 pages incl. all tables, figures and limits (in German).
Disclaimer: Historical statistics are no guarantee of future market behaviour. This study is not investment advice. Trading carries a risk of loss up to total loss.