Data basis: Daily data from Yahoo Finance, supplemented by Tiingo for delisted names, for 943 stocks. Universe: stocks that were S&P 500 members on the signal day (point-in-time lists from a public GitHub dataset). Share of members with price data in the search period 84% (2005) to 97% (2017), in the holdout 97% to 100%. Data hygiene fixed in advance: price at least 5 USD, no daily move above 50%, no frozen prices. Search period 2005–2018, separate holdout 2 January 2019 to 16 October 2026, exactly one run. Costs: 0.02 USD per share and side, spread 5 bps per round trip, overnight financing for long CFDs (interest plus 2.5% a year), dividends through adjusted prices; on average 24.0 bps (search period) and 18.9 bps (holdout) per trade. Benchmarks: random entries of the same stocks above the 200-day average with the same holding period, the same rule on SPY, random markets. Pre-registered on 21 October 2026 (SHA-256 d62f3944…). No trading recommendation.
On the three big US indices, buying after a short, sharp pullback passed our holdout (RSI(2) on US index CFDs). On twelve other markets the same family did not. The next question was obvious: does it also work on the single stocks inside those indices? Single stocks are expensive for CFD traders, mainly because of overnight financing, but a pullback trade lasts only about four days.
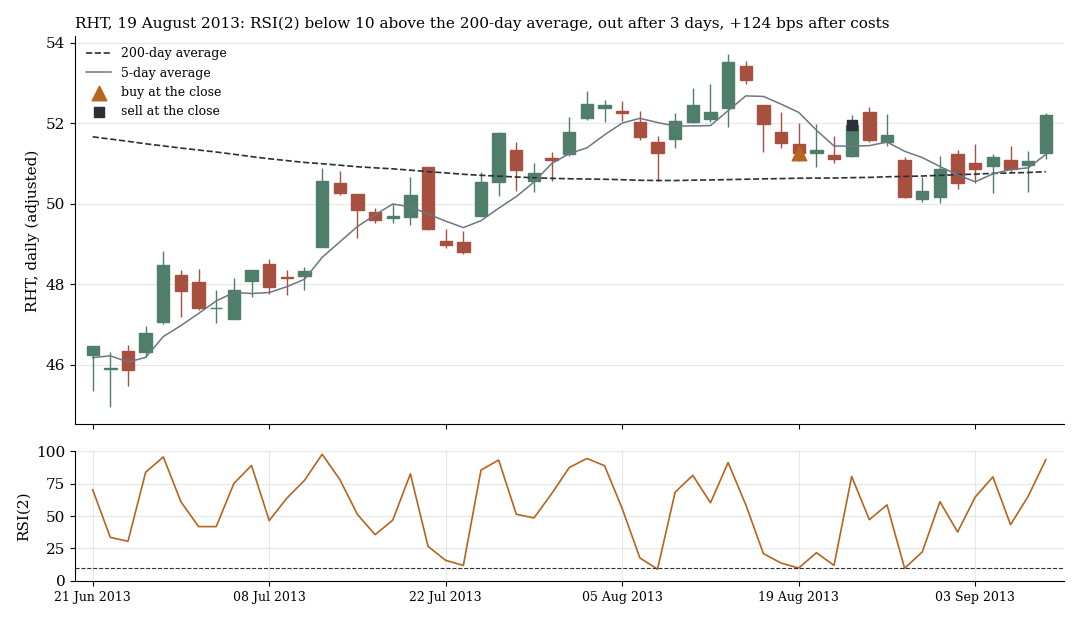
RHT, 19 August 2013: RSI(2) falls below 10, the stock is above its 200-day average. Buy at the close, sell at the first close above the 5-day average three days later, +123.6 bps after costs.
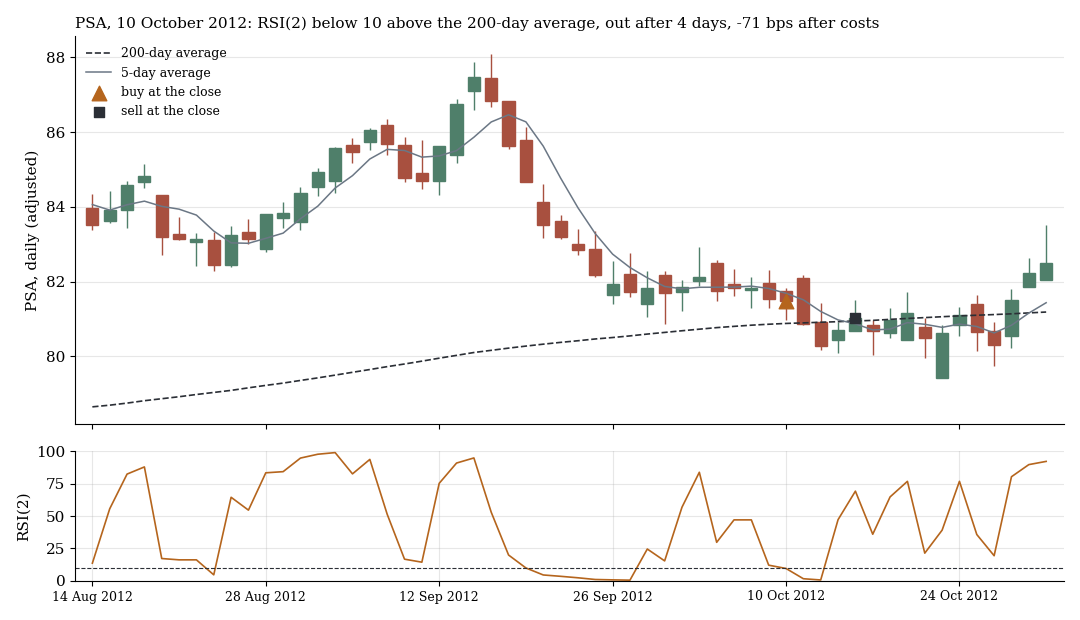
PSA, 10 October 2012: same signal, the price keeps falling, exit after four days at −71.3 bps. Both trades were drawn at random with a fixed seed (7) from the winning and losing trades of the rule in the search period.
1. The rule
Signal at the daily close: RSI(2) below 10 (variant S2: below 5) and close above the 200-day average. At least 250 trading days of history. Exit at the first close above the 5-day average, after ten trading days at the latest, one position per stock. Entry at the close of the signal day (E0, primary rule) or at the next open (E1). Four tests, multiple-testing correction across all four. Gate in the search period: net t ≥ 2, q ≤ 0.10 and above the 95th percentile of random entries. The holdout ran only after the gate was passed.
2. The search period: passed
| Variant | Entry | Trades | net bps | t | before costs | Holding period |
|---|---|---|---|---|---|---|
| RSI(2) < 10 | close | 39,922 | +17.21 | 2.07 | +41.24 | 3.8 days |
| RSI(2) < 10 | next open | 34,636 | −9.69 | −1.12 | +13.59 | 3.3 days |
| RSI(2) < 5 | close | 20,322 | +23.92 | 2.43 | +48.04 | 3.8 days |
| RSI(2) < 5 | next open | 17,824 | −1.46 | −0.14 | +21.77 | 3.2 days |
Search period 2005–2018, t clustered by entry week, 612 to 617 stocks per row.
The primary rule earned +17.21 bps (q 0.039). Random entries of the same stocks above the 200-day average averaged −6.95 bps, their 95th percentile was −4.48. The same rule on SPY earned +17.92 bps (110 trades, t 0.94). So the effect is no stock drift, but the SPY value also shows: the stocks deliver no more than the index.
A disclosure: the rule had already been calculated once before we fixed the data hygiene. Deleted tickers had frozen mini prices and penny prices in the Yahoo source, where the commission of 0.02 USD per share came to over 300 bps. That first run was at +14.0 bps (t 1.66, q 0.097) and would have narrowly missed the gate. We applied the hygiene to all project tests in advance and independently of its effect, and decided that only the run with hygiene decides on a holdout. Both runs are named here.
3. The holdout: confirmed locally
The holdout ran exactly once on 22 October 2026.
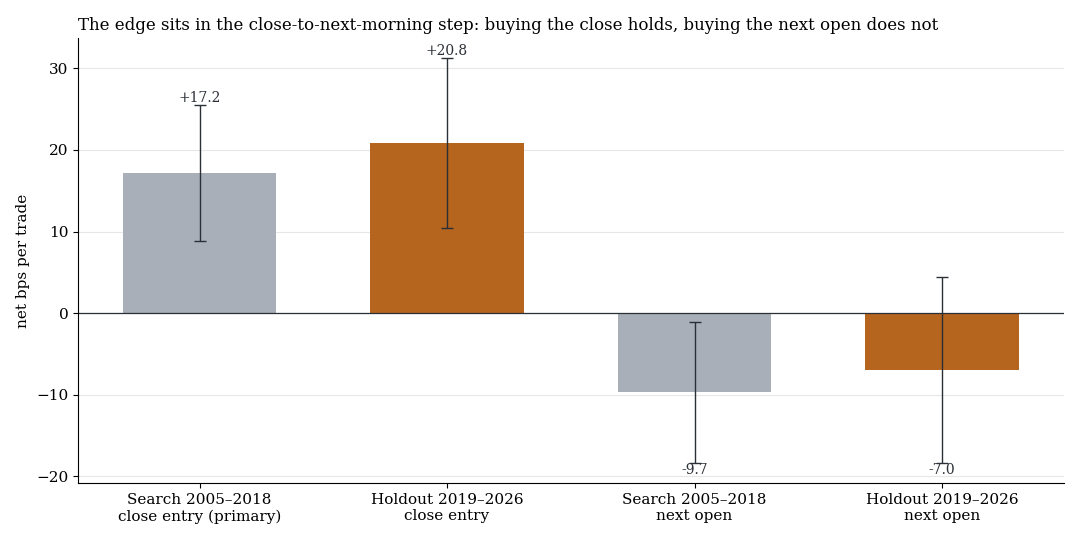
Net per trade with one standard error. Grey the search period, orange the single holdout.
| Variant | Entry | Trades | net bps | t |
|---|---|---|---|---|
| RSI(2) < 10 | close | 24,750 | +20.84 | 2.00 |
| RSI(2) < 10 | next open | 21,588 | −6.95 | −0.61 |
| RSI(2) < 5 | close | 12,903 | +23.97 | 1.87 |
| RSI(2) < 5 | next open | 11,459 | −2.96 | −0.21 |
The primary rule earned +20.84 bps (t 2.00, one-sided p 0.023), with costs × 1.5 still +15.59 bps. By our criteria that is confirmed locally. The years:
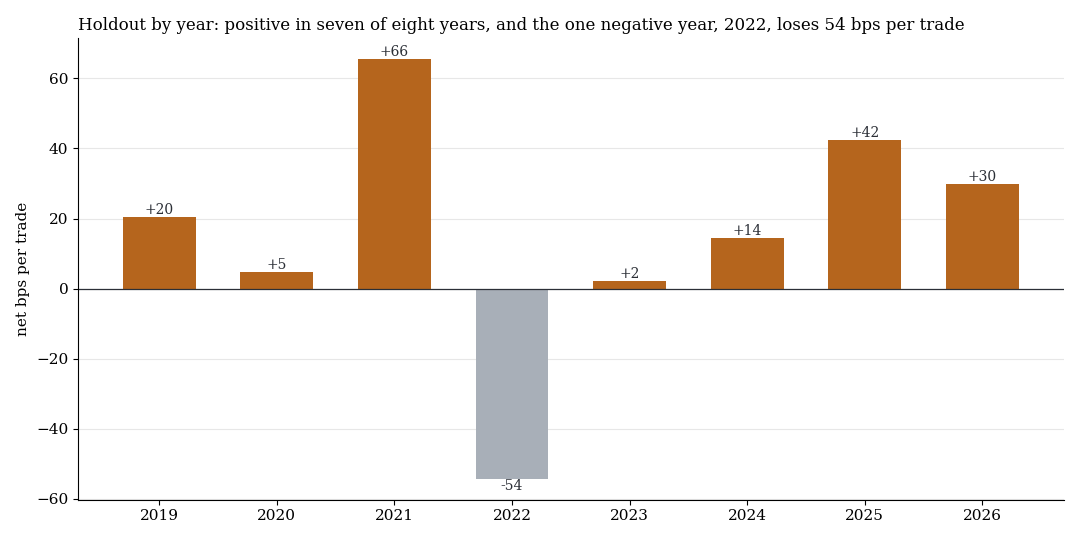
Net per trade by year, primary rule, 2019 to October 2026.
Seven of eight years are positive (2021 +65.6, 2025 +42.5, 2026 +29.9), 2022 is not: −54.3 bps. In the search period it was 2008, 2011 and 2018 (−20.3, −25.8, −55.2). The rule has a cluster risk: in stress phases many stocks give the signal at the same time, which we had noted in advance as a reservation.
Two findings for context. First, the effect carries only with the entry at the close. With entry at the next open the holdout shows −6.95 bps: the edge lies in the step from the close into the next morning. Second, a CFD can only be traded until 15:59 New York time, not at the closing auction. We therefore recalculated the rule on the real CFD daily candles of a broker (Pepperstone, MT5), 390 stocks from August 2020 to October 2026: +16.05 bps (t 1.49), against +19.93 bps (t 1.89) at the auction close of the same stocks in the same window. Execution thus costs about 3.9 bps, and the CFD close on signal days was on average 7.4 bps below the auction, favourable for long entries.
4. Not confirmed globally
A single holdout test says little when you run many. After the correction across all 110 holdout tests of the programme (Benjamini-Hochberg) this rule is at q 0.22. Only two rules passed: the FTSE event day (q 0.0015) and the RSI(2) pullback on US index CFDs (q 0.0044). The next best was at q 0.18.
5. Descriptive: robustness and regime (2005–2026)
The following numbers were calculated after the fact and are no test.
- Parameters. All 24 combinations of RSI threshold (5, 10, 15, 20), exit average (3, 5, 10 days) and maximum holding period (5, 10 days) are positive, the stricter the RSI and the longer the exit, the better. The base rule is at +18.6 bps (t 2.9).
- Regime. With VIX 19 and above +47.49 bps (t 3.12), with VIX 15 to 19 +12.37 (t 1.44), with VIX below 15 −4.23 (t −0.60). Stocks with high volatility +39.53 (t 4.46), with low volatility +1.25 (t 0.20).
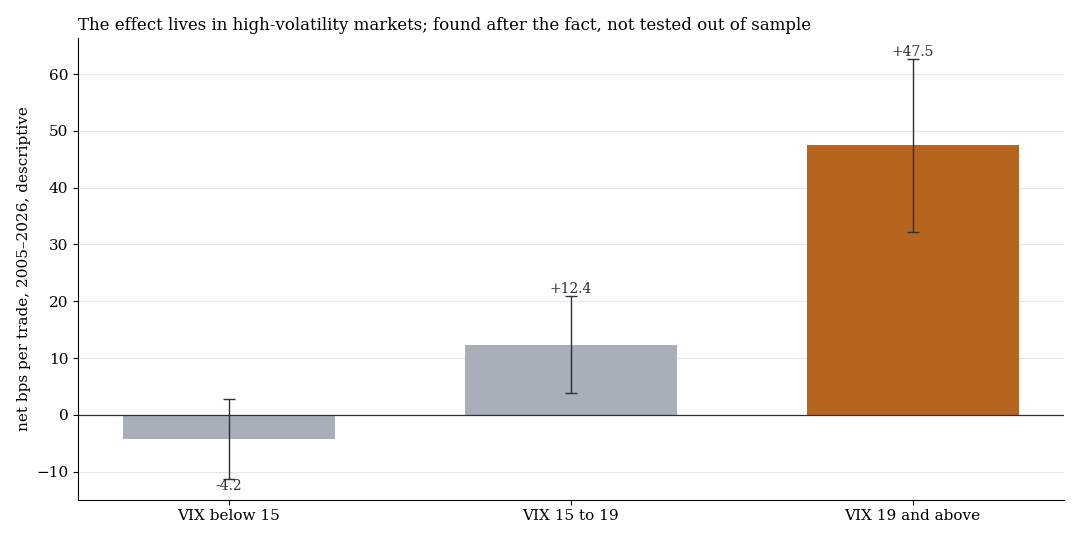
Net per trade by VIX regime, 2005–2026, descriptive. Orange: VIX 19 and above.
- Costs. With 5 bps spread +18.60 (t 2.86), with 10 bps +13.60 (t 2.09), with 15 bps +8.60 (t 1.32).
- As a portfolio. Equal weight, lowest RSI first, no leverage: with 5 positions +5.2% a year, maximum drawdown −31.4%, Sharpe 0.42; with 10 positions +4.4%, −31.2%, 0.44; with 20 +3.5%, −29.1%, 0.43. 2026 so far −16.3% with 10 positions. Picking the lowest RSI is on average worse than the rule over all signals (+8 to +10 bps per trade against +18.6).
We found the regime and volatility results only after the holdout. They can only be checked in a forward test now, the holdout is used up.
What it means
Buying the pullback on single stocks works in hindsight in two separate periods, before costs at about +40 bps per trade and after stock-CFD costs at +17 to +21 bps. The global correction across all tests keeps this from becoming a secure finding. As a standalone strategy the yield is weak: about 3.5 to 5.2% a year with one unit of capital and no leverage and drawdowns of around 29 to 31%, with a cluster risk when many names give signals at once. As a building block next to others the effect is more interesting than as a sole rule.
Limits
- Close entry. The effect hangs on entering at the close. On CFD candles it stays positive but smaller (t 1.49), and it covers only 2020–2026.
- Survivorship remainder. Coverage of members is 84 to 100%. Missing names are probably mostly delisted ones that may have done worse. That would rather flatter the result.
- Cost model. Spread 5 bps, commission 0.02 USD per share and side and a swap markup of 2.5% a year are assumptions based on one broker. Borrow fees are irrelevant (long only).
- Dividends. Not credited in the CFD recheck, which is conservative.
- Not tested: the short side, indices other than the S&P 500, a VIX filter in advance (only described after the fact), position size by volatility.
All pattern families and holdouts in the overview. Related: RSI(2) on US index CFDs, pullbacks on 15 markets and our workflow since October 2026.
📄 Full study as PDF: 9 pages incl. all tables, figures and limits (in German).
Disclaimer: Historical statistics are no guarantee of future market behaviour. This study is not investment advice. Trading carries a risk of loss up to total loss.