Data basis: S&P 500 stocks (point-in-time membership), daily data from Yahoo Finance and Tiingo, earnings dates and surprises from Yahoo Finance (18,397 reports of 464 stocks, coverage of members 59% in 2005 to 81% in 2017). Search period 2005–2018. The 2019–2026 holdout stayed untouched because the gate was missed. Every trade is market-adjusted: the stock against a counter leg in SPY. Costs: 0.02 USD per share and side, spread 5 bps per round trip (SPY leg 2 bps), overnight financing on both legs (interest ± 2.5% a year). Data hygiene fixed in advance: price at least 5 USD, no daily move above 50%. Benchmarks: random signs of the same trades, random days of the same stocks. Pre-registered on 21 October 2026 (quarterly results 6580f047…, short-term rules 63146581…). No trading recommendation.
Stocks have more events than indices, and a lot can be left per trade. That holds for CFDs too, as long as the holding period is short. We measured four event families on S&P 500 stocks, two drift ideas (after quarterly results, before the results) and two short-term ones (reversal after an extreme sell-off without news, continuation or reversal on the gap day after results). The index additions are in a separate study.
1. The drift after quarterly results
Two triggers, in quintiles of the last 90 days: the earnings surprise (SUE) and the first price reaction (EAR, return of the reaction day minus SPY). The top quintile goes long, the bottom short, hedged against SPY, entry at the close of the reaction day, exit after 5 or 20 trading days. As a third rule the pre-results premium buys the stock six to one day before the report. Primary: EAR with 20 days.
| Rule | n | before costs bps | net bps | t |
|---|---|---|---|---|
| Surprise (SUE), 5 days | 7,339 | +21.39 | −13.93 | −2.47 |
| Surprise (SUE), 20 days | 7,339 | +22.73 | −42.69 | −4.17 |
| First reaction (EAR), 5 days | 7,291 | +17.63 | −15.09 | −2.80 |
| First reaction (EAR), 20 days | 7,291 | +31.60 | −31.20 | −3.59 |
| Pre-results premium, 5 days | 18,397 | +13.48 | −18.92 | −4.36 |
Per trade, search period 2005–2018, market-adjusted, t clustered by calendar week.
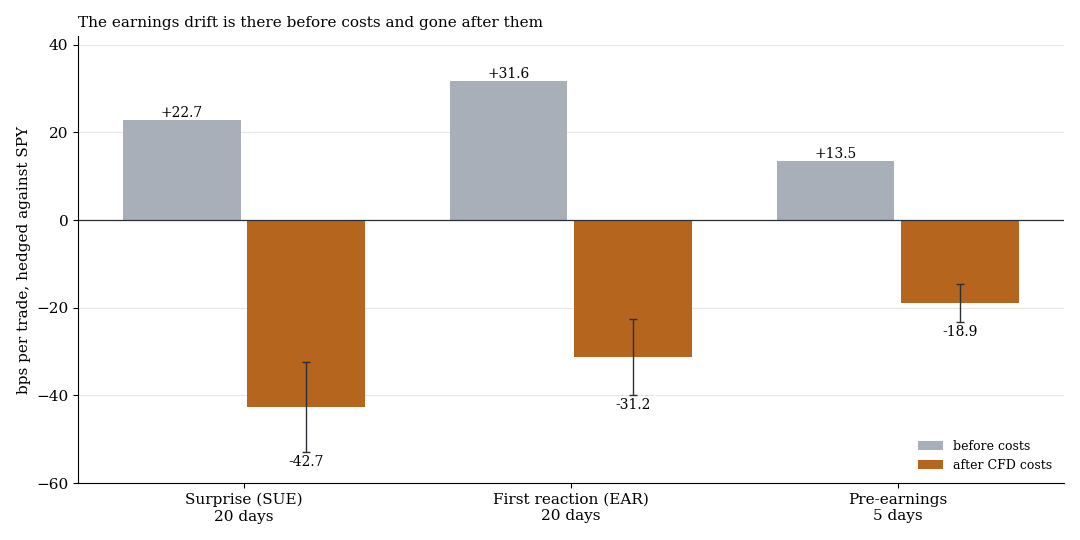
Light grey before costs, orange after CFD costs with one standard error.
The direction is real. With randomly swapped signs the same set of trades would be at −62.99 bps, the real direction adds about 32 bps. The costs eat that up, though: gross minus net is about 63 bps per trade in the primary test, most of it overnight costs, because both legs are held and the markup of 2.5% a year applies on both sides. The years swing widely, 12 of 14 are net negative (2009 +76.3 bps, 2018 −73.6 bps).
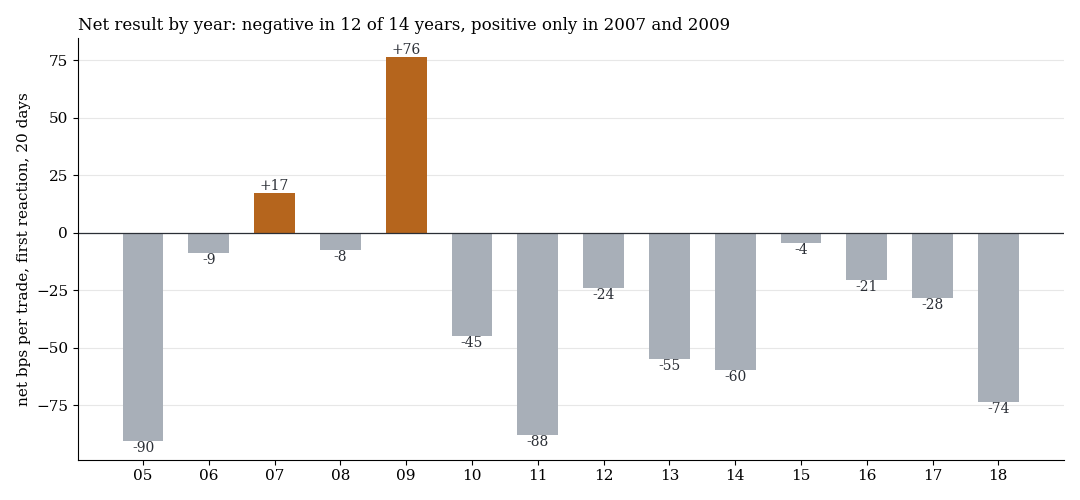
Net per trade, first reaction with 20 days, 2005 to 2018.
2. Short-term: extreme sell-off without news and the gap day
To keep the swap small we tested holding periods of at most three days.
Extreme sell-off without news. A stock falls on day d against SPY by at least three standard deviations of the last 60 days, without an earnings date from two days before to one day after. Long at the open of d+1 against SPY, exit after 1 or 3 days. Mirrored, the extreme rally (short).
Gap day after results. The gap to the open of the reaction day is in the top quintile of the last 90 days. Entry at the open in the direction of the gap (continuation) or against it (reversal), exit at the close of the same day.
| Rule | n | before costs bps | net bps | t |
|---|---|---|---|---|
| Extreme sell-off, long, 1 day | 7,500 | +2.21 | −19.76 | −3.91 |
| Extreme sell-off, long, 3 days | 7,498 | +9.94 | −16.16 | −1.74 |
| Extreme rally, short, 1 day | 8,278 | +6.41 | −15.50 | −2.43 |
| Extreme rally, short, 3 days | 8,277 | +12.61 | −13.47 | −1.36 |
| Gap day, continuation | 3,562 | +18.21 | −2.89 | −0.39 |
| Gap day, reversal | 3,562 | −18.21 | −39.31 | −5.33 |
Search period 2005–2018, market-adjusted, cluster t by entry week. Primary: extreme sell-off, 1 day (q 1.00).
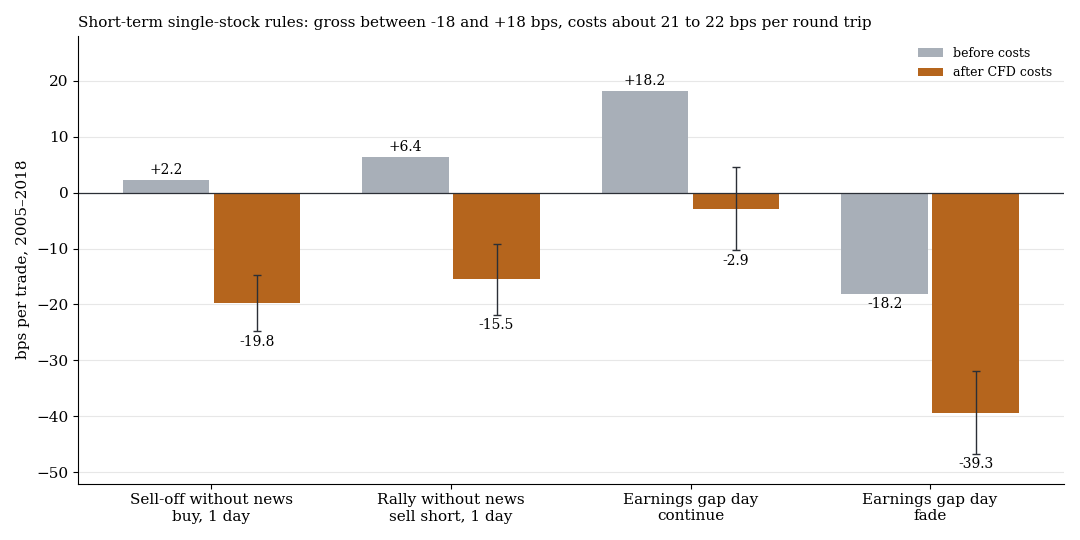
Before costs (grey) and after costs (orange, one standard error).
The costs are about 21 to 22 bps per round trip, and that is almost the whole finding: random days of the same stocks were also in the red at −21.51 bps (1 day). Before costs the gap day in continuation earns +18.21 bps, after costs −2.89 remain (t −0.39). That test would be the most interesting, but entry at the open is idealised with daily data, and a stock CFD only trades from 09:31 New York time, with no opening auction. Real fills would be worse.
What it means
After quarterly results there is real directional information before costs, 13 to 32 bps depending on the rule. The CFD as a vehicle swallows it: whoever holds a stock for weeks with a CFD pays overnight interest and the markup, and whoever holds it for one day pays about 21 to 22 bps of trading costs against an event of a few bps. Whether a stock in a cash account without that markup would come out differently, we did not measure. Our cost assumptions come from a CFD broker.
Limits
- Survivorship remainder. The earnings data cover 59 to 81% of the members, for delisted names Yahoo knows hardly any dates. That rather favours the surviving stocks.
- Yahoo surprise. Yahoo's consensus estimate is not equivalent to professional databases, and the assignment to before or after the market open is imprecise.
- Open fills idealised. Especially on the gap day.
- Borrow fees. Unknown for shorts on single stocks.
- Holdout not run because the gate was missed. 2019–2026 stayed untouched.
- Not tested: real shares without a swap markup, intraday entries after the open, selling rules with a stop.
All pattern families and holdouts in the overview. Related: RSI(2) on S&P 500 stocks, S&P 500 additions and published anomalies net of costs.
📄 Full study as PDF: 7 pages incl. all tables, figures and limits (in German).
Disclaimer: Historical statistics are no guarantee of future market behaviour. This study is not investment advice. Trading carries a risk of loss up to total loss.