Data basis: S&P 500 membership point-in-time from a public GitHub dataset, prices from Yahoo Finance and Tiingo (delisted names), hedge leg SPY. Announcement dates from the press releases of S&P Dow Jones Indices (259 releases 07/2012 to 10/2026, freely available). Search periods: from the effective date 2005–2018, from the announcement 2012–2018. Separate holdouts 2019 to October 2026, exactly one run each. Costs: 0.02 USD per share and side, spread 5 bps per round trip for the stock (deletions 10) and 2 bps for the SPY leg, overnight financing on both legs. Data hygiene fixed in advance: price at least 5 USD, no daily move above 50%, no frozen prices. Benchmarks: random dates of the same stocks. Pre-registered on 21 October (from the effective date, SHA-256 93d312ae…) and 23 October 2026 (from the announcement, 6f7cbbb4…). No trading recommendation.
When a stock is added to the S&P 500, index funds must buy it at the close before the effective date, regardless of price. Two trading ideas follow from this. First: the buying pressure is over, afterwards the price gives back, so short from the effective date. Second: between announcement and effective date the price keeps climbing, so long from the announcement. That the effect has become smaller since about 2010 is in the literature (Lynch and Mendenhall 1997, Chen, Noronha and Singal 2004).
A note on the data: at first we lacked the announcement dates, which is why there are two tests. The first knows only the day of the effective date, the second the announcement itself.
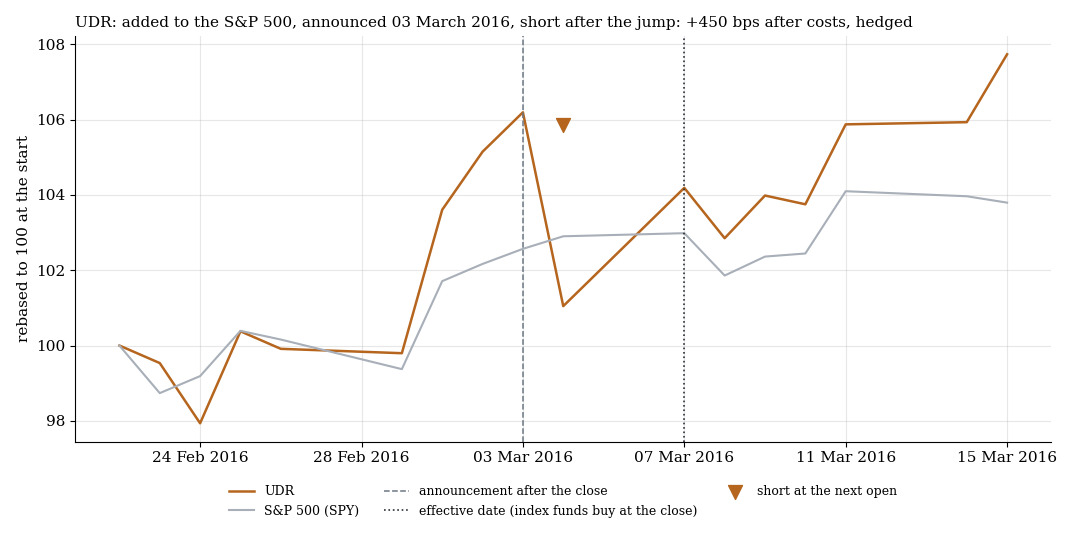
UDR, announced on 3 March 2016 after the close: short at the open of the next day, exit at the close before the effective date, hedged with SPY: +450.2 bps after costs.
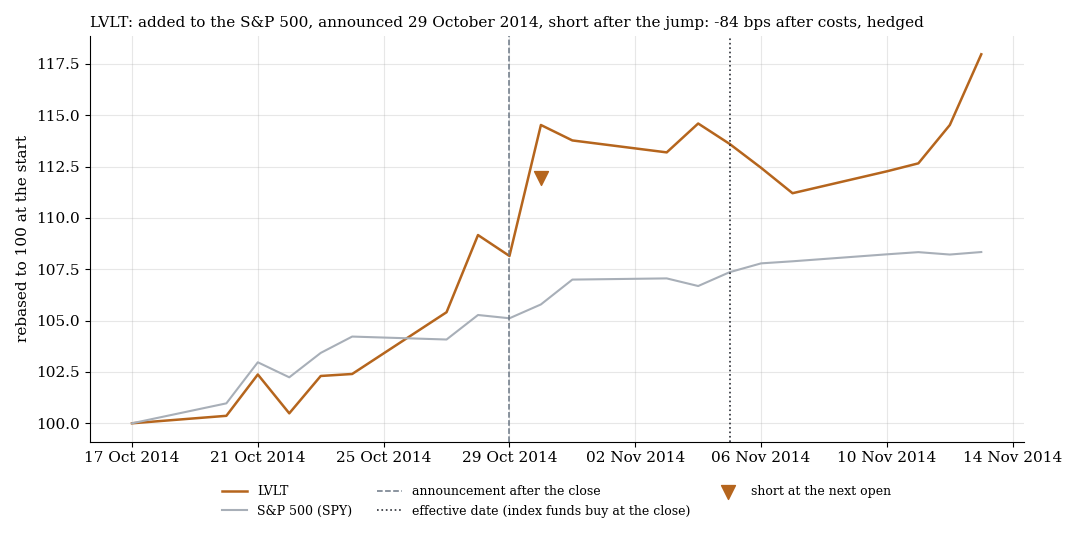
LVLT, announced on 29 October 2014: same rule, −84.1 bps. Both cases were drawn at random with a fixed seed (7) from the winning and losing trades of the mirrored rule in the search period.
1. From the effective date: short the addition, 20 days
Day 0 is the first trading day as a member. Short the stock at the open of day 0, long SPY with the same notional, exit at the close of day 19. We tested the addition (short) and the deletion (long), each with 5 and 20 days, and the primary hypotheses are both with 20 days.
| Search period 2005–2018 | n | net bps | t | Stock leg alone |
|---|---|---|---|---|
| Addition short, 5 days | 262 | +32.60 | 1.22 | +82.32 |
| Addition short, 20 days | 262 | +90.95 | 1.73 | +151.05 |
| Deletion long, 5 days | 88 | −11.77 | −0.18 | −11.76 |
| Deletion long, 20 days | 86 | +142.04 | 0.93 | +195.14 |
The primary rule (addition, 20 days) came to q 0.17 and thereby missed the gate. Random dates of the same stocks were themselves in the red as a short against SPY (mean −142.11 bps): the names in our data beat the index on average, so the comparison with chance is generous. Of the deletions only 35% were evaluable (117 of 338), because the prices of deleted, often acquired names are missing in free sources. The deletion numbers are therefore not reliable, and there was no holdout for them. For additions 76% were evaluable.
On our decision we ran the addition rule once in the holdout despite the missed gate, as a labelled exception: 2019 to October 2026, 145 cases. Result +65.27 bps (t 0.62, one-sided p 0.27), with costs × 1.5 +59.02, not confirmed. The short stock leg alone was at −70.31 bps. The positive total comes from the counter leg, the long SPY. The years scatter widely: 2019 −132.1, 2020 −275.2, 2021 +372.1, 2022 −110.2, 2023 +345.3, 2024 +395.0, 2025 +70.8, 2026 −76.0 bps.
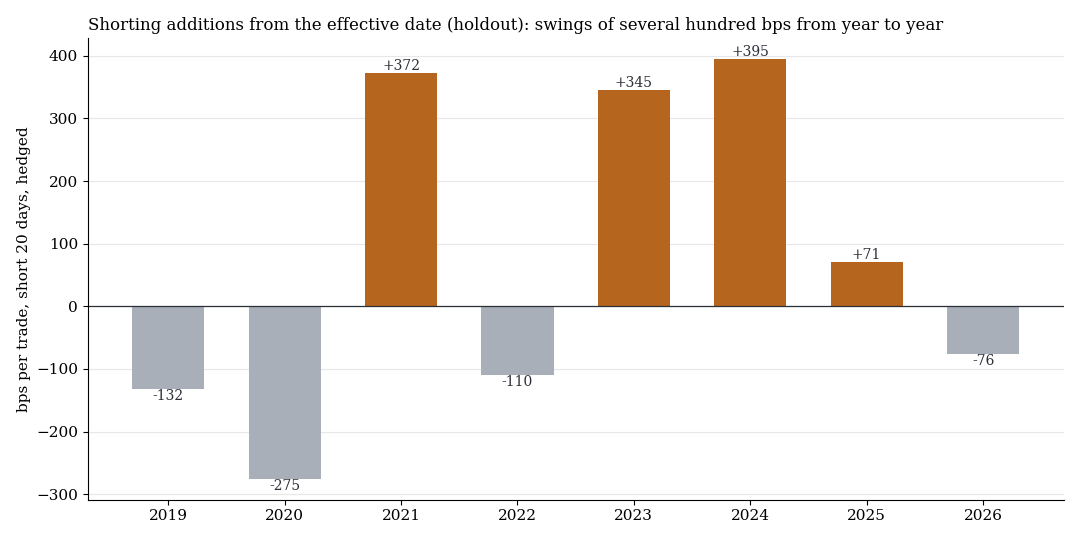
Net per trade by year, addition short, 20 days, hedged, holdout 2019 to October 2026.
2. From the announcement to the effective date
Releases come after the close (day A), the earliest entry is the open on day A+1. The effective date S is the trading day before the inclusion, on which the index funds buy at the close. The rule registered in advance: addition long at the open of A+1, exit at the close of S, hedged with short SPY.
| Search period 2012–2018 | n | net bps | t |
|---|---|---|---|
| Addition long, A+1 to the effective date | 112 | −154.96 | −5.82 |
| Deletion short | 47 | −156.38 | −1.64 |
The primary rule lost −154.96 bps (t −5.82), in all seven years (2012 to 2018: −134.5, −155.5, −105.8, −28.5, −234.8, −184.7, −171.1). The reason lies before the entry: the announcement jump from the close of day A to the open of A+1 was +155.5 bps, but it is not tradeable. Whoever buys long afterwards buys high, and the price gives back until the effective date.
Mirrored, that is after looking at the result, it looked like this: addition short at the open of A+1 to the effective date earned +116.87 bps (t 4.40) in the search period, positive in 6 of 7 years, 69% of trades in profit, clearly better than random dates of the same stocks (mean −65.01 bps). That looked like a find. A direction mirrored after the fact must not pass a gate, but it was worth a single holdout run, as a labelled exception.
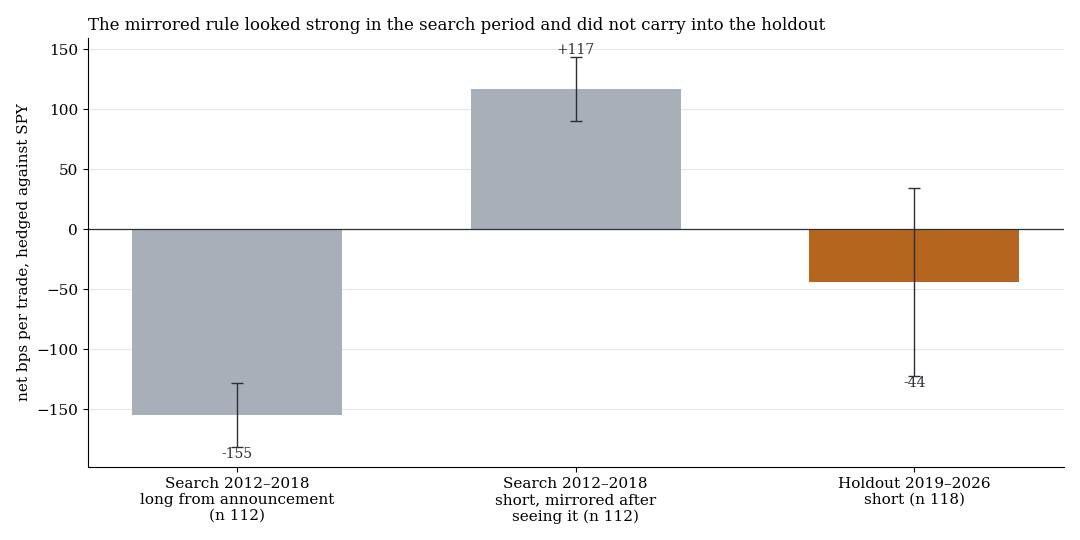
Net per trade, hedged against SPY, one standard error. Grey the search period (long as registered, short mirrored after the fact), orange the holdout.
In the 2019 to October 2026 holdout (118 additions) the mirrored rule earned −43.71 bps (t −0.56, one-sided p 0.71), with costs × 1.5 −49.41. Not confirmed. The years jump from −357.6 (2023) to +194.0 bps (2026). For the roughly one third of additions that are available as a CFD today it was −298.93 bps on 40 cases (t −1.83), and on 19 cases with CFD daily candles −528.41 against −513.48 bps at the closing auction.
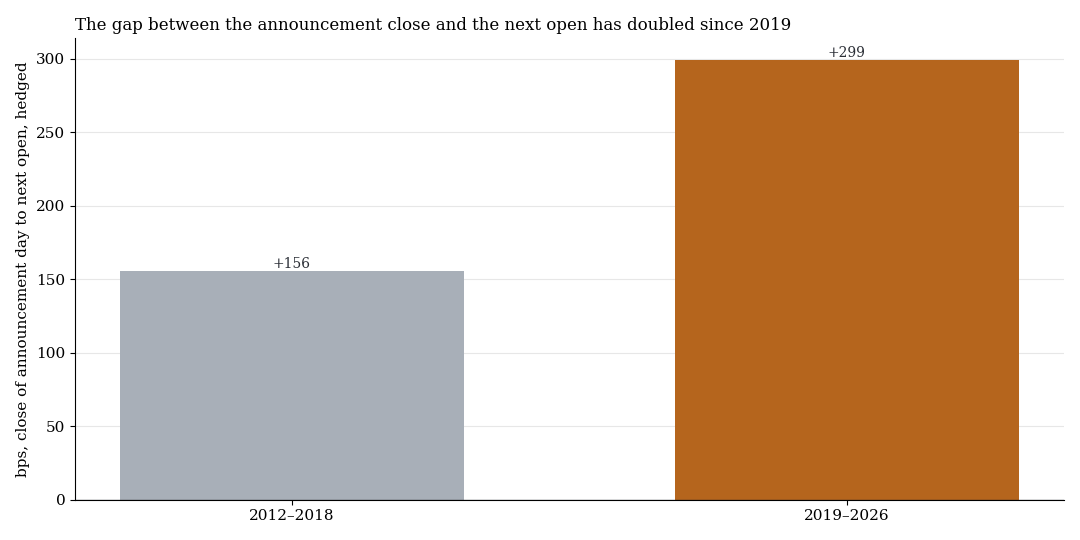
The jump from the close of the announcement day to the open of the next day, hedged, not tradeable. 2012–2018 +155.5 bps, 2019–2026 +299.2 bps.
The announcement jump has almost doubled since 2019, from +155.5 to +299.2 bps. To trade it you would have to know before the release what is being announced. After it, the holdout shows no reliable give-back that carries the short.
3. The count
In the global correction across all holdout tests of the programme (Benjamini-Hochberg) the addition exception from the effective date is at q 0.59, the mirrored announcement rule at q 0.95. Both are labelled as exceptions without a passed gate.
What it means
The index effect of the S&P 500 addition cannot be used as a trading rule with free data. The direction that looked strong in the search period did not hold in the holdout, and the announcement jump, the largest part of the move, lies before any possible entry. Since 2019 the swings from year to year are large. A possible cause, which we did not check: meme and retail trading that disturbs the textbook reversal. Only about one third of the additions of recent years has a stock CFD today, and at about five cases a year even a real edge would stay below what can be measured.
Limits
- Deletions not reliable. Only 35% evaluable in the search period and 55% in the holdout, because prices of deleted stocks are missing in free sources. The result there is explicitly not to be read as “no edge”.
- Announcement data. 78% of the additions and 84% of the deletions could be matched to a release. Missing events can shift the picture.
- Direction chosen after the fact. The mirrored rule was chosen after the search period. The holdout is an exception without a passed gate and should be read as a cross-check only.
- Borrow fees. For shorts on single stocks the borrow fees and the CFD availability are unknown.
- Closing price. A stock CFD trades only until 15:59 New York time, not at the closing auction at which the index funds buy.
All pattern families and holdouts in the overview. Related: index event days in the FTSE 100, forced flows, second round and RSI(2) on S&P 500 stocks.
📄 Full study as PDF: 8 pages incl. all tables, figures and limits (in German).
Disclaimer: Historical statistics are no guarantee of future market behaviour. This study is not investment advice. Trading carries a risk of loss up to total loss.