Data basis: Nasdaq 100 and S&P 500 CFDs, Dukascopy minute data on New York time, 237 reports after the close by Apple, Microsoft, Amazon, Alphabet, Meta, Nvidia, Tesla, Netflix and AMD, search period 2015–2022. After 16:00 the data set only has the minutes up to 16:14 (from 2018) and again from 18:00, with nothing in between. Costs outside the cash session 2.5 times the cash costs. Benchmarks: the opposite direction, a random direction, placebo days without a report, two random markets. Pre-registered on 2 November 2026 (SHA-256 305dd527…). No trading recommendation.
When a heavyweight publishes its numbers after 16:00, the index CFD jumps within minutes. The idea: the first breakout shows the direction of the reaction, and by the next morning's open the market prices in the rest. Going along early should capture part of it.
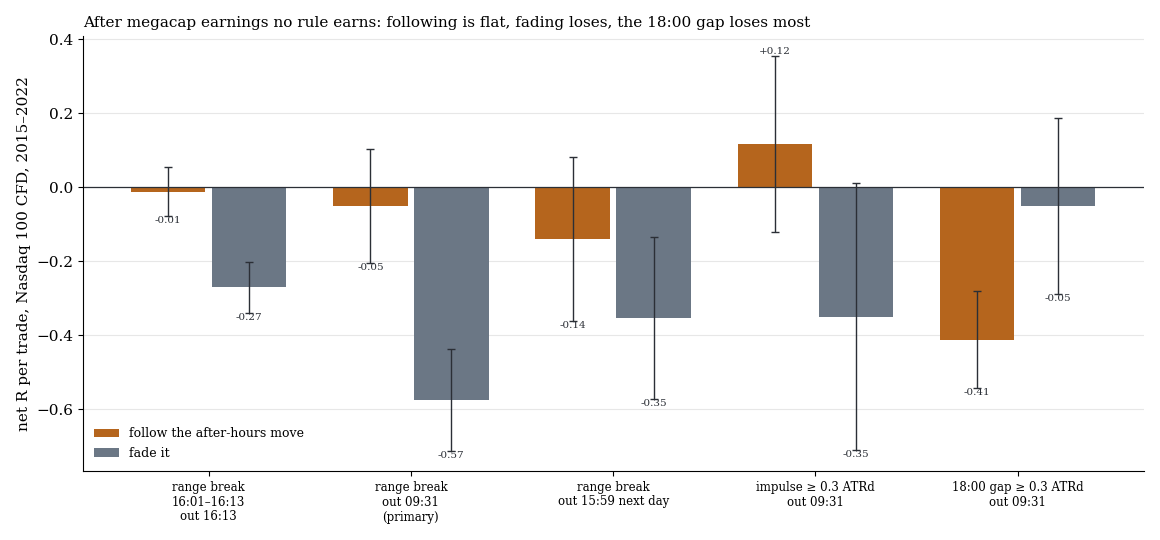
Net per trade in R with one standard error, Nasdaq 100 CFD. Orange follow the move, blue trade against it. From the left: breakout from the 16:01 to 16:13 range with three exits, impulse up to 16:13, gap at the reopening at 18:00.
1. The rules
| Trigger | Definition |
|---|---|
| T1 range breakout (primary) | price leaves the range of the minutes 16:01 to 16:13, entry in the breakout direction |
| T2 impulse | move up to 16:13 at least 0.3 daily ATR |
| T3 gap | price at 18:00 at least 0.3 daily ATR away from the close of the after-hours minutes |
| Exits | 16:13, open 09:31 the next day (primary), close 15:59 the next day |
| Risk | stop 0.3 daily ATR |
2. Result
| Trigger and exit (Nasdaq 100) | n | follow R (t) | hit rate | against the move R (t) | placebo days |
|---|---|---|---|---|---|
| T1, exit 16:13 | 80 | −0.012 (−0.18) | 50 % | −0.270 (−3.92) | −0.201 |
| T1, exit 09:31 | 80 | −0.051 (−0.33) | 38 % | −0.575 (−4.16) | −0.456 |
| T1, exit 15:59 | 80 | −0.140 (−0.63) | 29 % | −0.353 (−1.61) | −0.340 |
| T2, exit 09:31 | 35 | +0.117 (0.49) | 46 % | −0.350 (−0.97) | −0.401 |
| T3, exit 09:31 | 53 | −0.412 (−3.15) | 34 % | −0.050 (−0.21) | −0.723 |
Search period 2015–2022, net after costs. The primary rule is bold. q over 19 cells 0.88.
A breakout in the first minutes happens on 34 % of report days (80 of 237). The primary rule sits at zero, on the random markets at −0.089 and −0.496 R. The years jump: 2018 +0.99 R on 13 trades, 2019 to 2022 between −0.10 and −0.35 R. The S&P 500 looks the same, all cells around zero or below, pooled −0.065 R (t −0.44, 130 trades).
The breakout has direction, but not enough. From 16:00 to the open the price runs a mean 34.8 bps in the breakout direction, on 59 % of days. With a stop of 0.3 ATR, 46 % of these are stopped out by the morning, because the night swings more than the stop allows. Without a stop it is −0.169 R. Following the gap only at 18:00 buys too late: part of the after-hours reaction is given back by the open (−0.412 R). Trading against the gap brings nothing either (−0.050 R). Both directions negative means costs and stops produce the loss.
3. Open observation, not tested
In a descriptive look at all trading days, not only report days, we noticed that a clear direction in the first 15 minutes after the close tends to continue to the open when it is not given back right away. So far this is only an observation, without pre-registration, without costs and without a holdout. We publish no number on it before it is measured as a test of its own with costs outside the cash session, swap and an untouched holdout.
What this means
The reaction to megacap earnings is not a tradable breakout in the index CFD. This fits our measurement of the drift after earnings in single stocks, where there is direction before costs and nothing is left after costs.
Limits
- Data gap. 16:15 to 17:59 are missing, and 2015 to 2017 have no after-hours data at all. T1 and T2 rest on 2018–2022.
- Few trades. 80 in the primary rule, 35 in T2. Effects below about 0.3 R cannot be detected.
- Estimated costs. The factor 2.5 outside the cash session is an assumption; the real night spread around earnings can be wider.
- Holdout not run, because the gate was missed.
All pattern families and holdouts in the overview. Related: Macro events intraday and News trading in gold and bitcoin.
📄 Full study as PDF: 5 pages incl. all tables, figures and limits (in German).
Disclaimer: Historical statistics are no guarantee of future market behaviour. This study is not investment advice. Trading carries a risk of loss up to total loss.