Data basis: Nasdaq 100 and DAX as CFDs, Dukascopy minute data as 5-minute candles, search period 2015–2022, same session. The years from 2023 were not touched. Benchmark: the same detection and the same truth rule on a random market, where every minute candle is flipped around its open at random. Descriptive measurement without costs; it served as the basis for a training tool, and the truth rule was chosen on the random market, not on real data. No trading recommendation.
The double bottom is one of the best-known chart patterns: the price falls, forms a low, recovers, falls again to the same level and then turns up. Textbooks quote hit rates of 70 % and more. Before judging a double bottom by eye, one needs to know how often it holds purely mechanically. That base rate is the yardstick for any reading.
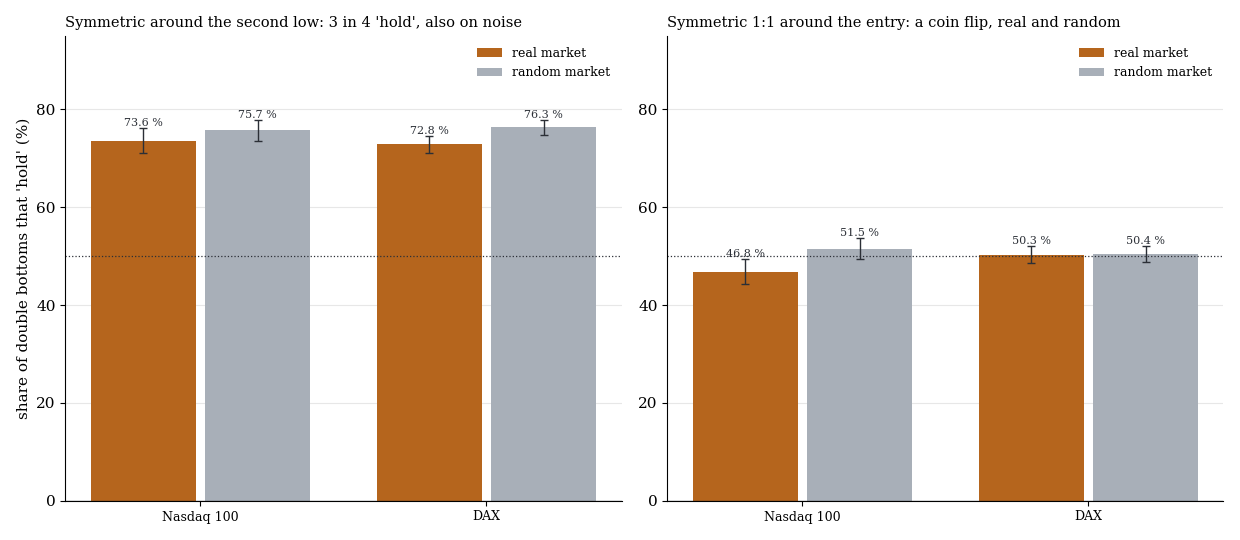
Share of double bottoms that “hold”, real (orange) against random market (grey), with one standard error. Left the common rule symmetric around the second low (neckline against the same distance below), right the symmetric rule around the entry.
1. Definition
| Component | Definition |
|---|---|
| Lows | two local lows (lowest point within ±3 candles), 10 to 60 candles apart |
| Same level | difference between the two lows at most 0.5 ATR |
| Middle high | at least 1 ATR above the lows (the neckline) |
| Lead-in | a decline of at least 3 ATR ends in the first low |
| Entry | close of the third candle after the second low |
| “holds” (symmetric) | the middle high is reached first |
| “fails” (symmetric) | the price first falls the same distance below the entry |
| Deadline | 48 candles within the same session, otherwise not counted |
ATR is the mean true range of the last 60 5-minute candles up to the second low. Only patterns in which one of the two thresholds is reached are counted.
2. Result
| Truth rule | Market | n real | holds real | n random | holds random |
|---|---|---|---|---|---|
| symmetric around the entry | Nasdaq 100 | 406 | 46.8 % ± 2.5 | 532 | 51.5 % ± 2.2 |
| symmetric around the entry | DAX | 778 | 50.3 % ± 1.8 | 882 | 50.4 % ± 1.7 |
| symmetric around low 2 | Nasdaq 100 | 318 | 73.6 % ± 2.5 | 436 | 75.7 % ± 2.1 |
| symmetric around low 2 | DAX | 670 | 72.8 % ± 1.7 | 744 | 76.3 % ± 1.6 |
| stop around low 2, target 1 R | Nasdaq 100 | 180 | 46.7 % ± 3.7 | 235 | 45.1 % ± 3.2 |
| stop around low 2, target 1 R | DAX | 434 | 45.6 % ± 2.4 | 475 | 52.2 % ± 2.3 |
Search period 2015–2022, ± one standard error. “Symmetric around low 2”: neckline against a level as far below the second low as the neckline is above it. “Stop around low 2, target 1 R”: the same stop level, target the same distance above the entry.
Under the symmetric rule the double bottom is a coin flip. In the DAX the real rate is identical to the random market's, in the Nasdaq 100 it is even slightly below (difference −4.7 points, t about −1.4). None of this is an edge.
3. The 73 % trap
Measured the way it is often described, whether the neckline is reached first or a level placed symmetrically to the neckline below the second low, 73 % of real double bottoms hold. That looks like a good pattern. The random market, however, reaches 76 %. The reason is geometry: three candles after the second low the entry already sits some way above the low, so the target is closer than the stop. A high hit rate with asymmetric distances says nothing about the pattern, only about the distances.
What this means
Mechanically the double bottom has no edge in these markets. Anyone who thinks they see more by eye needs the right base rate for comparison: not 50 %, and certainly not 73 %, but the rate the random market delivers with the same rule. Related: Chart patterns intraday against a random walk and Charm, double tops, Fibonacci and 15:50.
Limits
- One definition. Other thresholds for distance, level and lead-in give other sets.
- Only two markets and only 5-minute candles.
- Without costs. With costs, any rule at 50 % would be negative.
- Uncounted cases. Patterns where no threshold is reached within 48 candles drop out (Nasdaq 100 163, DAX 185 under the symmetric rule).
All pattern families and holdouts in the overview.
📄 Full study as PDF: 5 pages incl. all tables, figures and limits (in German).
Disclaimer: Historical statistics are no guarantee of future market behaviour. This study is not investment advice. Trading carries a risk of loss up to total loss.