Data basis: Part 1 (descriptive): daily data of the cash indices S&P 500, Nasdaq 100, Dow Jones and DAX from January 2000 to 24 September 2026, 26,951 market days, of which 1,682 with a new all-time high. Crossings and times of day from Dukascopy CFD minute data 2015 to June 2026. Definitions fixed before the calculation, no trading rule, no costs. Part 2 (rule test): 5-minute candles of the cash session, four markets, search period 2017–2022, benchmark two random markets, costs per round trip as in every study of this series. Pre-registered on 12 November 2026 (SHA-256 f18b2f55…). The holdout from 2023 stayed untouched because the gate was missed. No trading recommendation.
At the all-time high there are no old levels left above the market where anyone wants to sell. From this follows the expectation that the price has to run freely there. The experience at the screen is often different: the price reaches the high, falls back, reaches it again, and the day ends roughly where it first touched the level. Two questions from trading: how often does the price really run through at the all-time high? And is it worth trading a rising channel at the high to the upside?
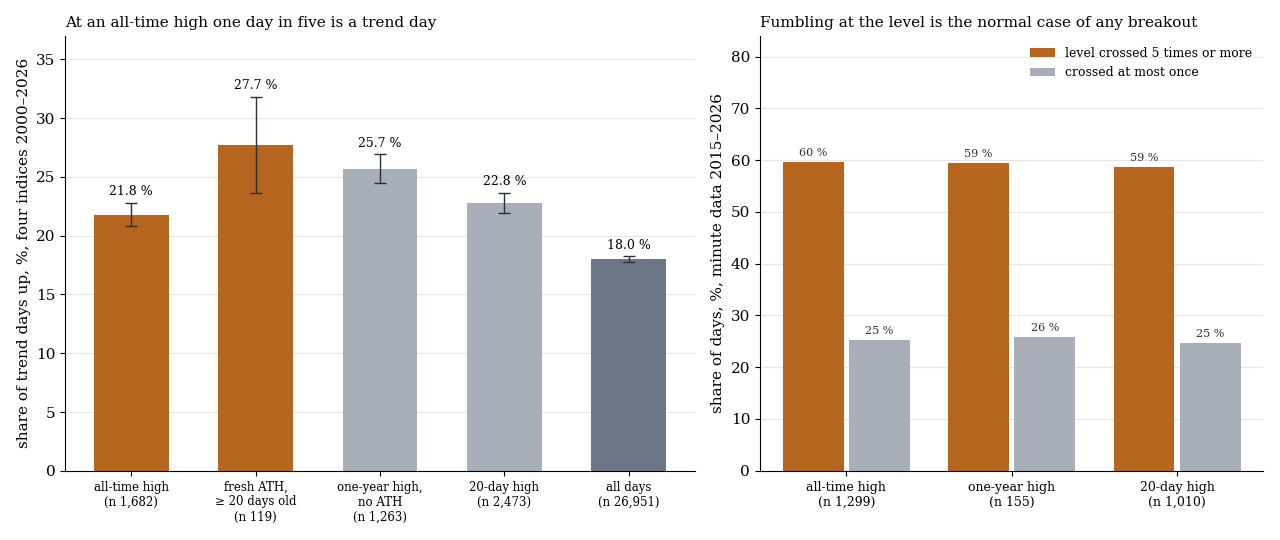
Left the share of upward trend days by type of day, four indices 2000–2026, with one standard error. Right the share of days on which the price crosses the exceeded level at least five times or at most once, minute data 2015–2026.
1. The definitions
| Term | Definition |
|---|---|
| All-time-high day | the day's high is above the previous all-time high |
| Fresh all-time high | the last all-time high is at least 20 trading days old |
| One-year high | the day's high is above the high of the last 250 days without being an all-time high |
| 20-day high | above the high of the last 20 days, neither all-time high nor one-year high |
| Trend day | close in the top fifth of the day's range and range at least 0.8 ATR of the 20 prior days |
| Holds | close above the exceeded level |
| Crossing | the minute close changes the side of the level |
All-time highs cluster in rising phases. The fair comparison is therefore not “all days” but an ordinary one-year high or 20-day high, which also arises in such phases.
2. How often the price runs through
| Type of day | n | trend day | close above the level | close ≥ 0.5 ATR above | close ≥ 0.25 ATR below | next day higher |
|---|---|---|---|---|---|---|
| All-time high | 1,682 | 21.8 % | 59.5 % | 18.2 % | 18.5 % | 54.8 % |
| Fresh all-time high | 119 | 27.7 % | 66.4 % | 16.0 % | 17.6 % | 50.4 % |
| One-year high, no all-time high | 1,263 | 25.7 % | 55.6 % | 15.0 % | 20.3 % | 54.1 % |
| 20-day high | 2,473 | 22.8 % | 56.1 % | 12.5 % | 17.8 % | 51.2 % |
| All days | 26,951 | 18.0 % | 53.6 % |
Four indices pooled, 2000–2026.
On a good one in five days with a new all-time high the price runs through. That is a little more than on an arbitrary day (18.0 %) but less than at an ordinary one-year high (−3.9 percentage points, t −2.5). In return the market closes above the level a little more often at the all-time high (+3.9 points, t 2.1). In four out of ten cases it closes below it again, in just under two out of ten clearly below. The next day is unremarkable.
3. The back and forth at the level
| Type of day | n | crossings (median) | at least 5 crossings | at most 1 crossing |
|---|---|---|---|---|
| Fresh all-time high | 87 | 7 | 60.9 % | 19.5 % |
| Other all-time highs | 1,212 | 7 | 59.6 % | 25.7 % |
| One-year high, no all-time high | 155 | 7 | 59.4 % | 25.8 % |
| 20-day high | 1,010 | 7 | 58.7 % | 24.7 % |
Minute data 2015 to June 2026, cash session.
The feeling that the market merely fumbles around at the high is right: on six out of ten days the price crosses the old high at least five times, seven times in the median. But it is not a property of the all-time high. At a one-year high and at a 20-day high the figures are the same. This is how the market behaves at any level it is just exceeding.
Splitting the all-time-high days by the number of crossings, the days with at most one crossing (328) are trend days in 30.5 % and close above the level in 78.7 %. The days with five and more crossings (775) do so in 17.2 % and 54.1 %. That is sorted after the fact and not a signal: how often the price crosses is known only in the evening.
4. Time of day and gamma
When the trend day runs. On trend days with an all-time high the DAX has reached a median 67 % of its cash move by 15:30 (51 days), on other trend days 62 % (360 days). On 39 % of these days more than half of the move falls into the time after the US open, otherwise on 37 %. The S&P 500 has reached 48 % by 12:00 New York on such days (78 days, otherwise 37 %), the Nasdaq 100 61 % (91 days, otherwise 46 %), the Dow 42 % (66 days, otherwise 45 %). That is not a uniform pattern.
Gamma. 76 % of the US days with an all-time high lie in the top third of a freely published series for dealer gamma in the S&P 500, measured the evening before. On all other days it is 33 %. High gamma goes with fewer trend days: on the other days the rate is 11.4 % in the top third and 22.5 % in the bottom third. This fits the damping derived in chapter 8 of the foundations and explains part of the sluggish picture at the high. Cause and effect are not separated by this, because rising prices raise the measured gamma themselves.
5. The rising channel at the all-time high
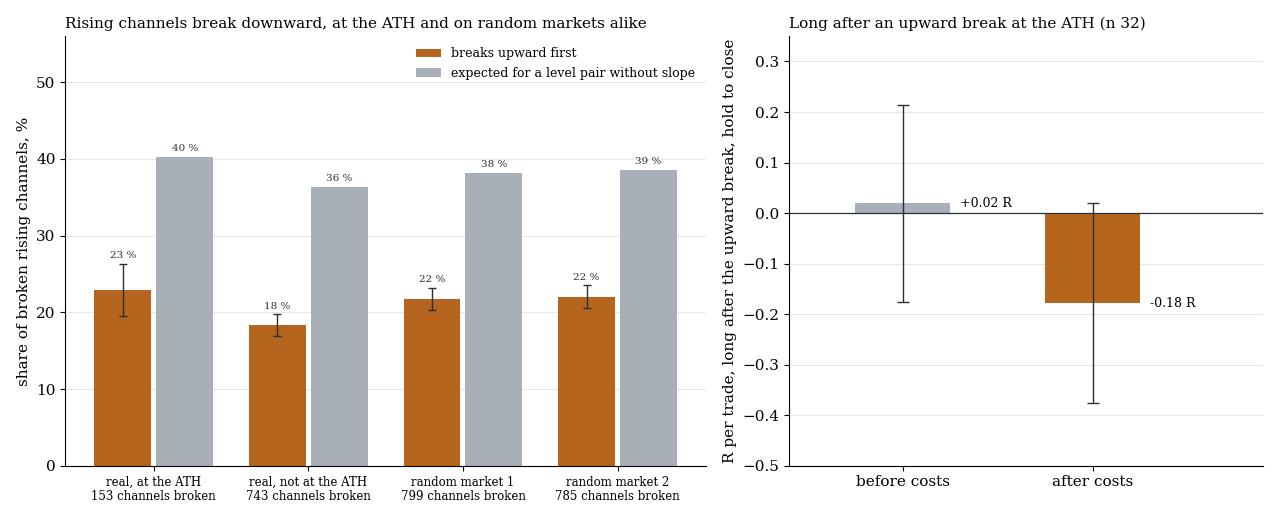
Left the share of broken channels that break upward first, against the expectation for two lines without slope, real with one standard error. Right the result of buying after an upward break at the all-time high, before and after costs.
A channel here consists of three rising turning lows on a straight line and two rising turning highs above it, all on the same day, 1.5 to 8 mean candle ranges wide, parallel or wedge-shaped. “At the all-time high” means: the price is at most half a daily ATR below the previous high. The trade is the purchase after a 5-minute close above the upper line, with the stop at the lower line and the exit at the end of the session.
| channels | of which broken | breaks upward first | expectation without slope | buy after upward break (n) | before costs | after costs | |
|---|---|---|---|---|---|---|---|
| real, at the all-time high | 176 | 153 | 22.9 % | 40.2 % | 32 | +0.02 R | −0.18 R (t −0.9) |
| real, not at the all-time high | 843 | 743 | 18.3 % | 36.3 % | 128 | −0.03 R | −0.13 R (t −1.2) |
| random market 1, not at the high | 899 | 799 | 21.8 % | 38.2 % | 169 | −0.03 R | −0.17 R |
| random market 2, not at the high | 913 | 785 | 22.0 % | 38.5 % | 167 | +0.12 R | +0.01 R |
2017–2022, four markets. On the random markets only 34 and 54 channels form at their own high, too few for a comparison.
A rising channel breaks downward in three out of four cases. That is not due to the all-time high, because away from it and on the random markets the rate is the same. It is geometry: the lower line rises toward the price, the upper one runs away from it. Buying after the rare upward break is at zero before costs and at −0.18 R per trade after costs. The gate is missed on all three points.
What this means
The all-time high is not a special level. The run through is the exception, the back and forth is the rule, and both hold just the same for any other breakout level. Neither the day with a new high nor a rising channel below it is a signal for a trend day. That the channel mostly breaks downward is not a signal either, but follows from its shape.
Limits
- Part 1 is descriptive. Base rates without a trading rule and without costs. Whether a breakout that holds for the first minutes runs through more often is not tested.
- Phase selection. All-time highs fall into rising phases. The comparison with one-year and 20-day highs softens this but does not remove it.
- Gamma only for the US and only from 2015. The sign of the dealer position is an assumption of the series.
- Narrow channel. The channel from turning points of one day is stricter than one drawn by hand. Multi-day channels on higher time frames are not tested.
- 32 trades. The rule test at the all-time high is small, and the all-time high there is approximated from CFD highs since 2015.
- Holdout not run, because the gate was missed.
All pattern families and holdouts in the overview. Related: the channel break downward and tests of 4-hour levels.
📄 Full study as PDF: 8 pages incl. all tables, figures and limits (in German).
Disclaimer: Historical statistics are no guarantee of future market behaviour. This study is not investment advice. Trading carries a risk of loss up to total loss.