Data basis: DAX, Nasdaq 100, S&P 500 and Dow, Dukascopy CFD minute data, aggregated to 4-hour candles, search period 2015–2022. 5,702 levels with 10,393 touches from the second on. Benchmark: two random markets with identical rules. Standard errors clustered by calendar week. The holdout from 2023 stayed untouched because the gate was missed. Pre-registered on 16 November 2026 (SHA-256 a4f302d3…). No trading recommendation.
There are two rules of thumb about horizontal levels, and they contradict each other. One says: every test weakens a level, because the orders there are worked off bit by bit, and at some point it breaks. The other says: a level that has held often is proven and will hold again. The occasion for this measurement was a concrete case, a former all-time high in the DAX that was tested from above eight times on the 4-hour chart and held as support. Intraday we had asked the question once before, at the TWAP on trend days, there up to the third touch. Here it is about multi-day levels and up to eight and more touches.
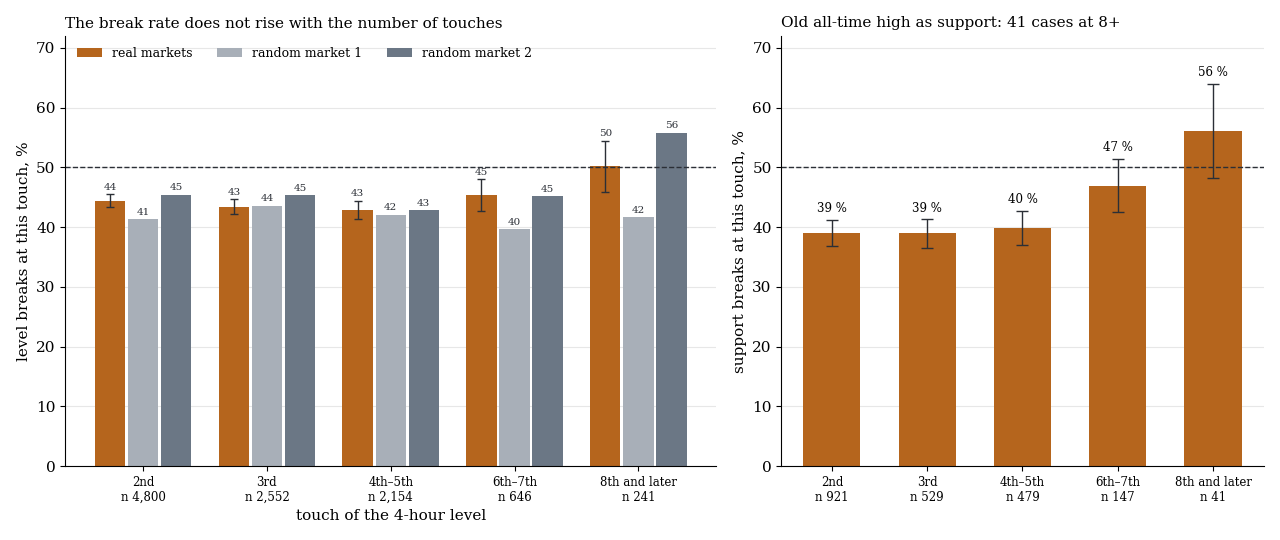
Left the share of touches at which the level breaks, by the number of the touch, real with one standard error and on two random markets. Right the same rate for supports at a former all-time high.
1. The rules
| Building block | Definition |
|---|---|
| Level | a turning point on the 4-hour chart: lowest low (support) or highest high (resistance) of seven candles, known three candles later |
| Yardstick A | mean range of the last 60 4-hour candles |
| Touch | a candle comes within 0.3 A of the level, after the previous touch has held |
| Hold | first 4-hour close at least 1.5 A on the right side of the level |
| Break | first 4-hour close at least 1.5 A beyond the level, after which the level is done |
| Old all-time high | support at a former high that was the highest of the data when it formed and was exceeded afterwards |
So not every brief tap is counted. Between two touches the price has to have moved away from the level by at least 1.5 mean candle ranges. The turning point itself is the first touch, the evaluation starts at the second.
The gate: the break rate from the sixth touch on has to differ from that at the second with |t| ≥ 3, this difference has to be at least two standard errors away from the random market, and a trade in the prevailing direction has to be positive after costs.
2. Result
| Touch | n real | breaks, real | support only | support at the old all-time high (n) | random market 1 / 2 |
|---|---|---|---|---|---|
| 2nd | 4,800 | 44.4 % | 39.2 % | 39.0 % (921) | 41.3 % / 45.4 % |
| 3rd | 2,552 | 43.4 % | 38.9 % | 38.9 % (529) | 43.6 % / 45.3 % |
| 4th to 5th | 2,154 | 42.9 % | 40.4 % | 39.9 % (479) | 42.1 % / 42.8 % |
| 6th to 7th | 646 | 45.4 % | 42.5 % | 46.9 % (147) | 39.7 % / 45.2 % |
| from the 8th | 241 | 50.2 % | 47.4 % | 56.1 % (41) | 41.7 % / 55.8 % |
Support and resistance pooled, four markets, 2015–2022. The 241 touches from the eighth on come from 123 levels with a median age of about 1,000 candles, roughly eight months.
The gate is missed on all three points:
- No rise. From the sixth touch on the level breaks 2.3 percentage points more often than at the second (t 0.8). For supports only it is 4.7 points (t 1.4). Required was |t| ≥ 3.
- The random market shows the same. The difference is 0.9 and 0.0 standard errors above the two random markets, for supports 1.6 and 0.6. The second random market even reaches 55.8 % from the eighth touch on.
- Nothing tradable. From the sixth touch on (887 cases) the level breaks in 46.7 %. Picking the better side afterwards and betting on a hold gives 0.07 R per trade before costs. But on the random market the level holds just as often there.
By market and in both halves of the data there is no uniform picture either. In the DAX the break rate from the eighth touch on is 52 % (56 touches at 29 levels).
3. The old all-time high as support
For the case that triggered the question, the series looks like a rise at first glance: 39 % at the second touch, 47 % at the sixth and seventh, 56 % from the eighth on. But the last figure rests on 41 touches at 25 levels, and its standard error is 7.9 percentage points. Its distance to 50 % is thus smaller than one standard error. With this data it can be shown neither that an often tested old high is more likely to break nor that it is more likely to hold.
4. Why supports hold more often
A support breaks at the second touch in 39 % of cases, a resistance in about 50 %. That is not a property of the levels. The four indices rose from 2015 to 2022, and a rising market moves away from a level upward more often than downward. On top of that comes the geometry of the count: on the random markets too, the break rate of 41 to 45 % is below 50 %.
What this means
The number of tests is not a signal, neither for a break nor for a hold. A level that has held eight times stands before the ninth test roughly where it stood before the second. This fits what we measured at round numbers and other levels and at the TWAP: whether a level holds is not decided by its history.
Limits
- Strict count. Between two touches we require a move away of 1.5 mean candle ranges. Counting smaller bounces on the chart as well gives more touches; that count is not tested.
- Thresholds not varied. Approach within 0.3 A, decision at 1.5 A and turning points from seven candles were fixed once.
- Dependent touches. Several touches of the same level are not independent. The standard errors are clustered by calendar week, which captures the dependence only in part.
- Small samples at the end. 241 touches from the eighth on, 41 at the old all-time high. The all-time high is approximated from the data since 2015.
- Holdout not run, because the gate was missed.
All pattern families and holdouts in the overview. Related: days at the all-time high.
📄 Full study as PDF: 6 pages incl. all tables, figures and limits (in German).
Disclaimer: Historical statistics are no guarantee of future market behaviour. This study is not investment advice. Trading carries a risk of loss up to total loss.