Data basis: Our own rule book of 25 combinations of breakout rule and market (DAX, FTSE 100, Dow, Nasdaq 100) on the corrected calculation chain, Dukascopy minute data, search period 2015–2022 with 38,682 trades, holdout 2023 to 5 June 2026 with 16,655 trades, exactly one run. All values net after costs in R (1 R = distance from entry to stop). Benchmark: the same arms on two random markets. Pre-registered on 10 November 2026 before any calculation (SHA-256 3c4e953c…). Market selection is a descriptive addition in the search period only (2016–2022). No trading recommendation.
The idea came from our own trading: the same breakout rules as before, but with more risk on days of high volatility, shorts with a trailing stop when volatility is high, longs held to the session close. Plus the wish for a tool that shows before the open which market is worth trading today.
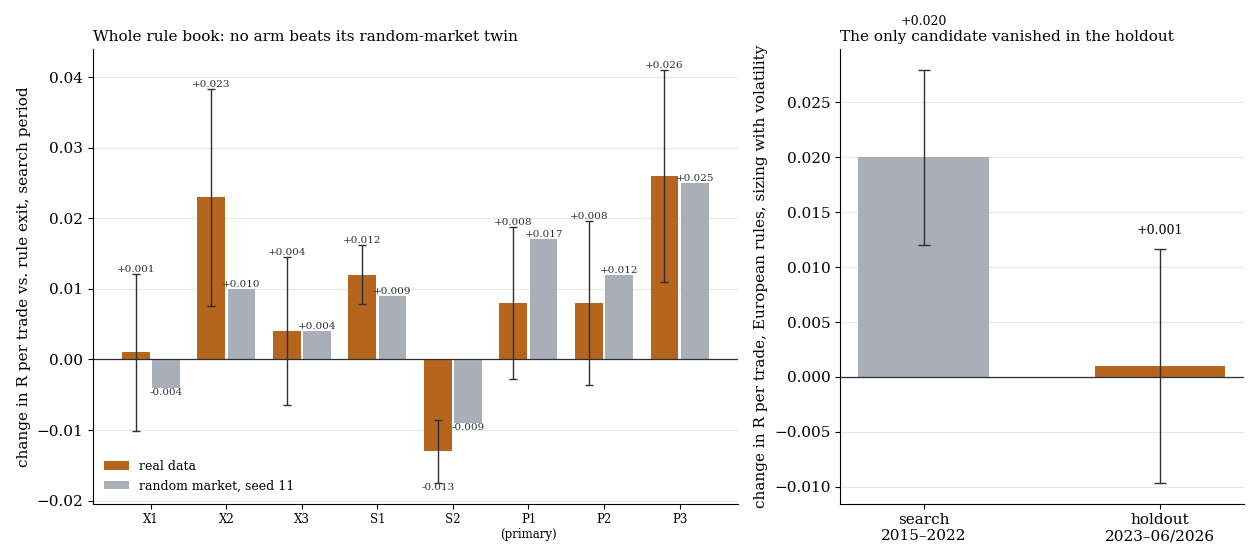
Left the change per trade against the rule's own exit across the whole rule book, real (orange, with one standard error) and on the random market. Right the only candidate, the European rules with size by volatility, in the search period and in the holdout.
1. Eight arms
The volatility regime is the mean daily range of the prior five days, in thirds against the last 250 days per market, known before the open.
| Arm | Definition |
|---|---|
| X1 | longs held to the session close, shorts with a trailing stop |
| X2 | as X1, shorts only when volatility is high, otherwise no short |
| X3 | as X1, shorts with trailing when volatility is high, otherwise held |
| S1 | the rule's exit, size 0.5 / 1.0 / 1.5 at low, medium, high volatility |
| S2 | counter-check: size 1.5 / 1.0 / 0.5 |
| P1 (primary) | exits X3 with sizes S1 |
| P2, P3 | exits X1 and X2 with sizes S1 |
Four units (whole book, European rules, US rules, one follow-on breakout rule) times eight arms make 32 tests. Weights are normalised to the same risk budget. Gate: improvement t ≥ 2, q ≤ 0.10, and both random markets with |t| < 2 and less than half the effect.
2. Result
| Whole book, search period | Δ R per trade | t | q | Random market 1 (t) | Book R per trade |
|---|---|---|---|---|---|
| Rule's exit (base) | −0.087 | ||||
| X1 | +0.001 | 0.09 | 0.96 | −0.004 (−0.46) | −0.086 |
| X3 | +0.004 | 0.38 | 0.77 | +0.004 (0.39) | −0.083 |
| S1 size with volatility | +0.012 | 2.90 | 0.06 | +0.009 (2.24) | −0.074 |
| P1 (primary) | +0.008 | 0.75 | 0.60 | +0.017 (1.56) | −0.079 |
The primary rule changes nothing. More size at high volatility looks significant across the whole book (t 2.90), but the random market shows the same effect (t 2.24). The reason is mechanics: on large daily ranges the costs are smaller relative to the stop, so every trade loses less in R, even without direction. The only candidate left was S1 on the European rules (+0.020 R, t 2.51, q 0.097, random market t 0.83).
Holdout 2023 to June 2026: +0.001 R (t 0.09), not confirmed. The book of this unit was at −0.069 R per trade there.
The exit idea does not hold either. In the search period, shorts at high volatility ran at +0.072 R when held to the close and at −0.079 R with trailing, the opposite of what was expected. In the holdout, holding was at −0.042 R there. Longs ran better held than trailed in every regime, but never reliably positive.
A warning about the holdout: the run printed all 32 cells, not just the candidate. Some arms such as X2 (shorts only at high volatility) look better there (t 2.5). Those are no longer tests but seen numbers, and X2 drops trades, which helps mechanically in a negative book. We do not count them.
3. Which market today?
For market selection we measured figures known in advance per market and day: volatility percentile, volatility expansion (5 against 60 days), gap at the open, prior-day move, VIX percentile and two trend measures.
| Figure, top against bottom third | Daily range (t) | Trend-day rate | Book R per trade |
|---|---|---|---|
| Volatility expansion | 0.82 → 1.00 (12.9) | 12.2 % → 19.0 % | −0.102 → −0.062 |
| VIX percentile | 0.84 → 0.97 (9.7) | 11.9 % → 19.0 % | −0.166 → −0.029 |
| Gap at the open | 0.82 → 1.03 (14.9) | 12.8 % → 19.7 % | −0.129 → −0.039 |
| Efficiency of the last 10 days (visible trend) | 0.91 → 0.91 (0.2) | 16.3 % → 15.2 % | −0.037 → −0.136 |
7,069 market days, DAX, FTSE 100, Dow and Nasdaq 100, 2016–2022. Daily range relative to the usual range.
Whether a day will move can be estimated well in advance. A visible trend, on the other hand, predicts neither range nor trend day, and the book runs worse after it. For choosing between markets all of this brings almost nothing: picking the market with the highest value each day makes the range only 0.02 to 0.05 larger, and the book improves in no case (all |t| ≤ 1.5). The information sits in the day, not in the market.
What this means
Volatility is a regime of the day, not a lever that turns a negative rule book around, and not a tool for picking the right market. As a display of “how active will today be” it is useful, as a signal it is not.
Limits
- One rule book. The result holds for our breakout rules; other strategies may react differently to volatility.
- Thirds as regimes. Finer or different volatility measures are not tested.
- Market selection only four indices and only in the search period. Gold, currencies and crypto are missing.
- Minute bars. Stop before target in the same minute, no ticks.
All pattern families and holdouts in the overview. Related: Our process since October 2026.
📄 Full study as PDF: 5 pages incl. all tables, figures and limits (in German).
Disclaimer: Historical statistics are no guarantee of future market behaviour. This study is not investment advice. Trading carries a risk of loss up to total loss.