Data basis: Adjusted daily closes of 507 current and 17 former S&P 500 members, June 2015 to September 2026, membership as of each date, SPY as the index. All books dollar-neutral, return per year per unit of gross exposure. Three cost levels: gross, institutional 1 bp per side, stock CFD 3 bp per side plus a 3 % financing surcharge per year per leg. Benchmark: random selection with the same turnover. t-values with Newey-West correction. Descriptive measurement of 11 October 2026, without a separate holdout (all years in one calculation). No trading recommendation.
Statistical arbitrage was long the core business of quantitative funds: buy stocks that have lagged their index or their sector, and sell the ones that ran ahead. Or look for pairs that historically move together and trade their deviation. The question was whether anything of it is left in large US stocks and whether it carries after costs.
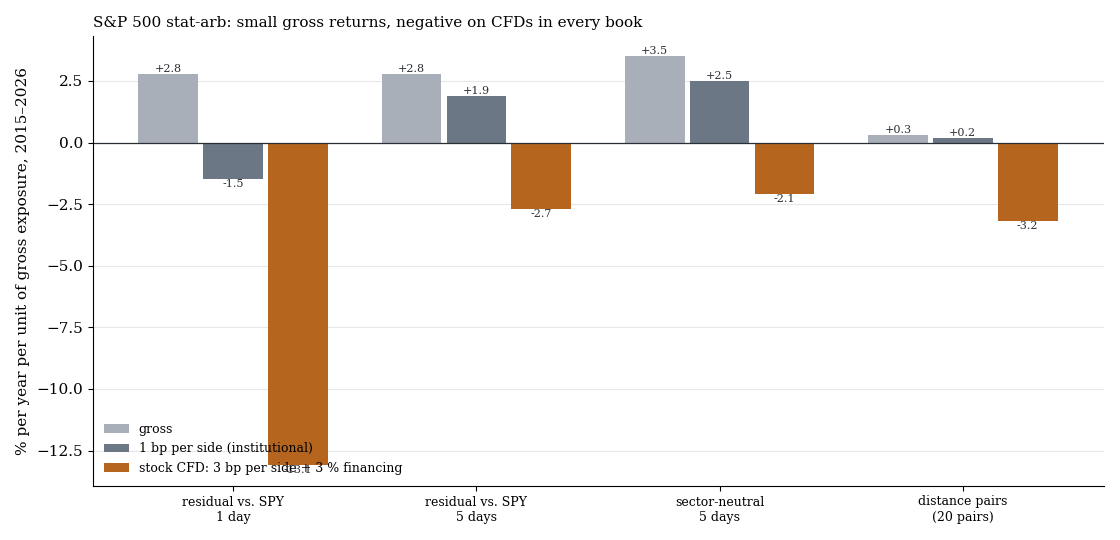
Annualised return per unit of gross exposure, entry at the signal close. Grey gross, blue with institutional costs, orange with the costs of a stock CFD.
1. Four books
| Book | Definition |
|---|---|
| A1 residual 1 day | return minus beta times SPY return (beta from 60 prior days), bottom tenth long, top tenth short, hold 1 day |
| A5 residual 5 days | the same over 5 days, hold 5 days |
| S5 sector-neutral 5 days | residual against the mean of the stock's own sector, 5 days |
| Pairs | 252-day formation, 20 pairs with the smallest distance, entry at 2 standard deviations, exit at zero or after 126 days, a new portfolio every month |
2. Result
| Book | Turnover per day | gross % p.a. (t) | Sharpe gross | 1 bp per side | Stock CFD |
|---|---|---|---|---|---|
| A1 residual 1 day | 172 % | +2.8 (1.08) | 0.32 | −1.5 | −13.1 (t −5.05) |
| A5 residual 5 days | 35 % | +2.8 (1.20) | 0.38 | +1.9 | −2.7 |
| S5 sector-neutral 5 days | 36 % | +3.5 (1.74) | 0.54 | +2.5 | −2.1 |
| Pairs (20) | +0.3 (0.82) | +0.2 | −3.2 (t −2.36) |
June 2015 to September 2026, 2,782 trading days, entry at the signal close. Pairs: 118 portfolios, t from 20 non-overlapping portfolios.
Gross, no book reaches t 2, not even the best one. Randomly chosen tenths with the same turnover sit at −0.4 to −0.8 % per year gross. Entering one day later changes little (S5 +2.9 %, Sharpe 0.49). With institutional costs something is left in the 5-day books, but not significantly. With the costs of a stock CFD every book is negative, the fast 1-day book clearly so at −13.1 %.
The years show where the gross return comes from: in 2020 the 5-day books bring +17 to +19 %, the other years sit around zero. This fits the literature, according to which short-term reversal is mainly paid liquidity provision in crises.
What this means
Stat-arb on large US stocks is today a business for houses with costs below one basis point and intraday data. With CFDs on single stocks it is negative. This fits our published anomalies after costs and the lead-lag between index markets, where mean reversion between two index CFDs was smaller than the costs of two legs.
Limits
- Survivorship. Prices are missing for almost all former members (only 17 replacement series). This favours reversal strategies because the later losers are missing. Positive numbers are therefore upper bounds.
- Closing prices only. No spreads, no short-sale constraints, no dividend compensation on the short side.
- No separate holdout. The measurement is descriptive over all years; an edge would first have had to pass a holdout.
- Not tested: intraday stat-arb, broader universes, index arbitrage of future against basket.
All pattern families and holdouts in the overview.
📄 Full study as PDF: 6 pages incl. all tables, figures and limits (in German).
Disclaimer: Historical statistics are no guarantee of future market behaviour. This study is not investment advice. Trading carries a risk of loss up to total loss.