Data basis: Four descriptive measurements without a trading rule and without costs. (1) Late bounce: Nasdaq 100, S&P 500 and Dow as CFDs, Dukascopy minute data, January 2015 to June 2026, 8,507 market days. (2) Tight range at the low: Nasdaq 100 and S&P 500 on sell-off days (at 14:00 New York at least 2 % below the prior close and at most 1 % above the day's low), 183 days. (3) Shape of significant lows: Nasdaq 100 index, daily candles since 2000, intraday from 2015. (4) Days with at least −5 % intraday and a reversal, Nasdaq 100 index since 2000. The benchmark is always the base rate of all comparable days. Cluster t by date. No trading recommendation.
This study collects four questions that came from trading on sell-off days. Does the bounce still come in the evening, especially on Fridays? What does it mean when the range at the low suddenly becomes small? What do significant lows look like, V or saucer? And can they be recognized while they form?
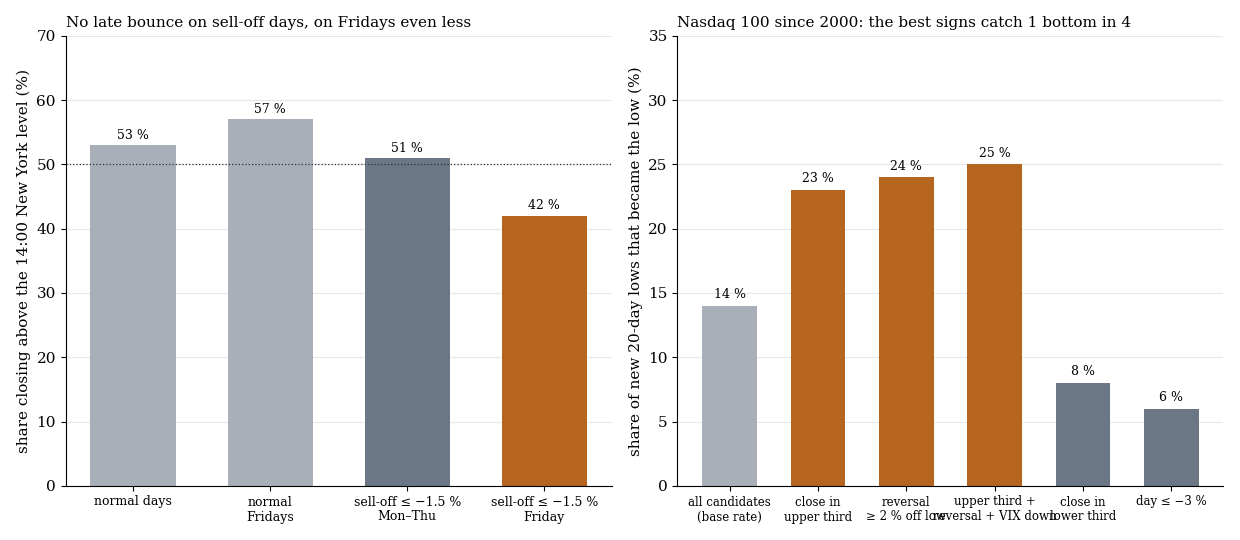
Left the share of days that close above the 14:00 New York level. Right the share of new 20-day lows in the Nasdaq 100 that actually became the low, by features of the day.
1. No late bounce
| Group (level at 14:00 New York) | n | closes higher | at least +0.3 % | mean % (t) | new day low afterwards |
|---|---|---|---|---|---|
| normal days | 7,582 | 53 % | 15 % | +0.01 (0.96) | 24 % |
| normal Fridays | 1,463 | 57 % | 17 % | +0.05 (2.65) | 21 % |
| sell-off ≤ −1.5 %, Monday to Thursday | 377 | 51 % | 29 % | +0.00 (0.01) | 69 % |
| sell-off ≤ −1.5 %, Friday | 141 | 42 % | 25 % | −0.12 (−1.17) | 70 % |
On sell-off days a bounce of at least 0.3 % comes in 25 to 29 % of cases, on normal days in 15 to 17 %. The mean stays at zero, though, slightly negative on Friday, and 70 % of the days still make a new low after 14:00. The “Friday evening bounce” is a memory of the outliers, not the rule. On the Monday after, 59 % close above Friday's close (+0.20 %), as many as on the day after a weekday sell-off (59 %, +0.28 %).
2. Tight range at the low
The idea: from 14:00 the range right at the low becomes very small, no 5-minute close below it, but no distance upwards either. A real compression (half an hour with at most 20 % of the day's mean hourly range) did not happen a single time on the 183 sell-off days. What looks small on the chart is the normal afternoon decline in volatility. The tightest third of the late blocks covers only 6 days in the Nasdaq 100 and says nothing: −0.64 % to the next close (t −0.8). When the low is broken between 14:00 and 15:30, the Nasdaq 100 breaks it again the next day in 77 % of cases.
3. What bottoms look like
Significant low means: the lowest low within ±20 trading days and at least 5 % below the 20-day high. In the Nasdaq 100 since 2000 there are 82 such lows.
| Feature | Value |
|---|---|
| V-shaped (+3 % within 3 days, at most 2 days at the low) | 71 % |
| Saucer (at least 5 closes near the low) | 2 % |
| Days at the low | median 1, 78 % at most 2 |
| Low day itself a reversal day | 39 % |
| Return from the low day's close, +1 / +10 days | +1.75 % / +7.07 % |
| Intraday (Nasdaq 100 from 2015, 33 lows): minutes after the low still within 0.3 % | median 11 |
4. The trap: most V days are not the bottom
Looking back, bottoms are V-shaped. Looking forward you only see candidates: a new 20-day low at least 5 % below the high happened on 586 days since 2000, and only 14 % of them became the low.
| Feature on the candidate day | n | became the low | z |
|---|---|---|---|
| all candidates | 586 | 14 % | |
| close in the upper third | 142 | 23 % | 3.2 |
| reversal of at least 2 % off the low | 122 | 24 % | 3.3 |
| upper third, reversal and VIX falling | 61 | 25 % | |
| close in the lower third | 311 | 8 % | −4.4 |
| day ≤ −3 % | 109 | 6 % | −2.6 |
The best features double the rate but stay at one bottom in four candidates. RSI(2), gap, red streak and daily range do not help. An extreme example: 11 days since 2000 on which the Nasdaq 100 fell at least 5 % intraday and turned hard brought a mean of −1.94 % the next day (27 % positive).
What this means
Bottoms are fast, and that is exactly why they are hard to catch: the time at the low is usually minutes, and most strong reversal days are not the low. No bottom-timing setup can be built from this. Related: The day after large US moves and VIX curve, VVIX and gamma.
Limits
- Descriptive. No pre-registration, no costs, no holdout. All numbers describe what happened.
- Small groups. 82 significant lows, 33 intraday, 11 reversal days with −5 %. The results are directions, not estimates to the decimal.
- Chosen definitions. 5 % decline and ±20 days; variants with 8 % and ±40 days show the same picture (V 77 %, saucer 0 %).
- Index data. The shape measurements use the Nasdaq 100 index, not the CFD.
All pattern families and holdouts in the overview.
📄 Full study as PDF: 5 pages incl. all tables, figures and limits (in German).
Disclaimer: Historical statistics are no guarantee of future market behaviour. This study is not investment advice. Trading carries a risk of loss up to total loss.