Data basis: Nasdaq 100, S&P 500, Dow, DAX, gold and EURUSD as hourly candles from Dukascopy CFD minute data, search period 2015–2022. The holdout from 2023 stayed untouched because the gate was missed. Costs per round trip as in every study of this series (spread and slippage per market). Benchmarks: the same trade logic at the plain 0.5 and 0.618 levels without confluence, a random level between 0.382 and 0.786, two random markets. Pre-registered on 30 October 2026 before the first calculation (SHA-256 34004eb6…). No trading recommendation.
The idea comes from chart practice: you draw Fibonacci sequences from top to bottom. In an uptrend you buy only in the correction, and only at a price where two sequences meet. The up move has its retracement there, the down sequence of the correction its extension target. Two independent reasons at the same price should carry twice. A second sentence from the same practice comes with it: the more impulsive the move, the deeper the correction.
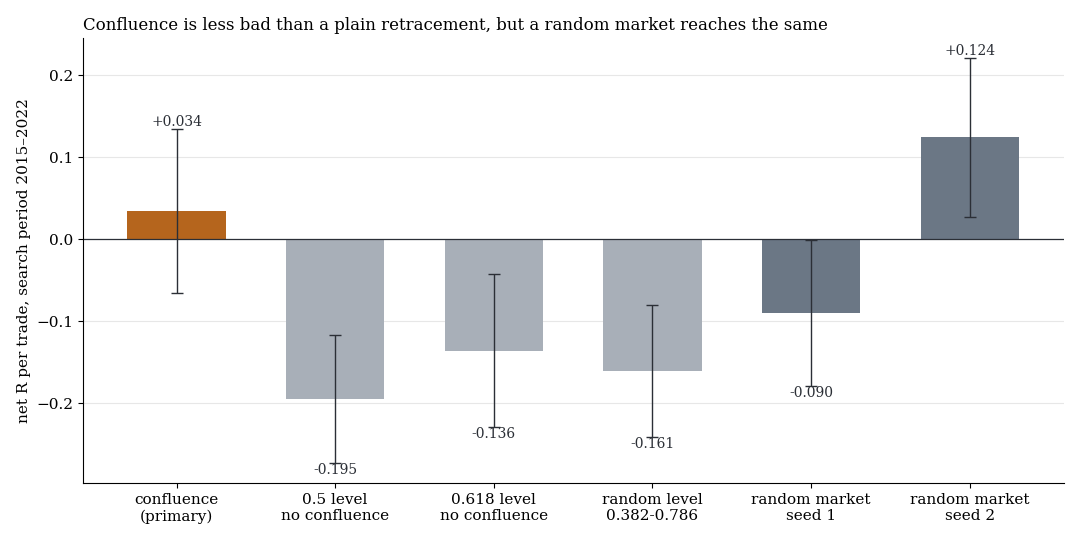
Net per trade in R with one standard error. Orange the confluence rule, grey the plain levels and the random level of the same corrections, blue the same confluence rule on two random markets.
1. The rule
| Component | Definition |
|---|---|
| Trend (known the day before) | daily close above SMA50 and SMA20 above SMA50 |
| Up leg | zigzag on hourly candles with a 2.0 daily-ATR reversal, from the confirmed low to the running high |
| Retracement levels | 0.382, 0.5, 0.618 and 0.786 of the up move |
| Extension targets | small zigzag (0.5 ATR) inside the correction, targets 1.0, 1.272 and 1.618 |
| Confluence | a target lies at most 0.1 ATR from a retracement level, buy limit in the middle |
| Trade | stop 1 ATR below the entry, target the old high, otherwise exit after 10 trading days |
ATR is the mean daily range of the prior 20 days. Pooled over the six markets (cluster t by date), plus each market on its own, multiple-testing correction over seven tests. Gate: net t ≥ 2, q ≤ 0.10, better than the plain level and the random level, and better than the random market.
2. Result
| Rule | n | net R | t | net bps |
|---|---|---|---|---|
| Confluence (primary) | 228 | +0.034 | 0.34 | +11.5 |
| 0.5 level without confluence | 327 | −0.195 | −2.50 | −23.8 |
| 0.618 level without confluence | 248 | −0.136 | −1.46 | −16.9 |
| Random level 0.382 to 0.786 | 326 | −0.161 | −1.99 | −19.4 |
| Confluence on random market 1 | 207 | −0.090 | −1.01 | |
| Confluence on random market 2 | 204 | +0.124 | 1.28 |
Search period 2015–2022, net after costs. One-sided p 0.37, q 0.51.
Confluence does better than the plain retracement (difference +0.203 R, Welch t 1.93) and than the random level (+0.195 R, t 1.70). That sounds like a finding, but it is only “less bad”: in absolute terms the rule sits at zero, and on a market without any direction the same rule reaches +0.124 R. By market the range runs from −0.268 R (EURUSD) to +0.191 R (gold), none above |t| 1.3. The table also shows a general rule: buying retracements in an uptrend with a stop of one ATR loses, whatever the level.
3. The more impulsive, the deeper?
For each completed large up leg we measured its speed and the depth of the following correction relative to the leg. On real data the two are weakly related (Spearman +0.236, 751 legs). On the random markets the relation is almost as large (+0.168 and +0.198). The median correction depth after slow, medium and fast legs is 0.77, 0.95 and 1.12 on real data, and 0.84 to 0.87, 0.91 to 0.95 and 1.07 to 1.19 on the random markets. The sentence is right in direction, but the zigzag filter produces it on its own: a fast leg more often ends at a spike that is fully retraced afterwards.
What this means
Two Fibonacci reasons at the same price do not add up to an edge that differs from chance. This fits our earlier measurements, where Fibonacci zones and measured moves behaved as in a random market.
Limits
- Few trades. 228 in the primary rule, 29 to 46 per market. The standard error is around 0.1 R, smaller effects stay invisible.
- One definition. Zigzag thresholds 2.0 and 0.5 ATR, confluence tolerance 0.1 ATR and stop 1 ATR were set once and not varied.
- Hourly candles. Smaller time frames and other targets (for example 1.272 instead of the old high) are not tested.
- Holdout not run, because the gate was missed. 2023–2026 stayed untouched.
All pattern families and holdouts in the overview. Related: Charm, double tops, Fibonacci and 15:50 and The random market as a ruler.
📄 Full study as PDF: 5 pages incl. all tables, figures and limits (in German).
Disclaimer: Historical statistics are no guarantee of future market behaviour. This study is not investment advice. Trading carries a risk of loss up to total loss.