Data basis: S&P 500 cash index, daily data (open, high, low, close). Cboe volatility indices: VIX (30 days), VIX9D (9 days) and VIX1D (1 day), in each case the closing value of the prior day, so known before the open. Two periods: 2015–2022 (2,014 days, without VIX1D) and January 2023 to September 2026 (934 days, with VIX1D). Reference value: realised volatility of the last 20 days. Descriptive measurement of forecast quality, without a trading rule and without costs. No trading recommendation.
The expected move is the movement the options market prices in for a period. For one day it is usually calculated from an implied volatility: index level times volatility, divided by the square root of 252. Which volatility is used for this matters. The VIX measures the next 30 days, the VIX9D the next nine, the VIX1D only the next trading day. In an earlier study we showed that the expected move is not a boundary for the price. Here it is about the simpler question of which of the three variants hits the size of the next day best.
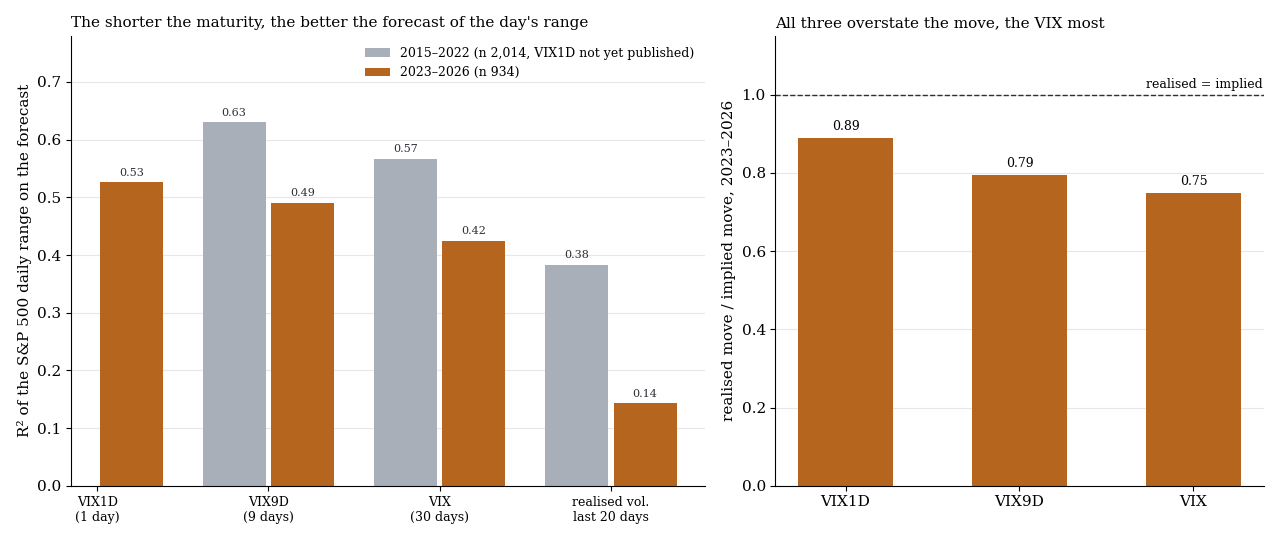
Left the share of the variation of the daily range that each forecast explains (R²), 2015–2022 and 2023–2026. Right the actual daily move in relation to the implied one, 2023–2026. A value of 1 would mean: the forecast is right on average.
1. The measurement
| Building block | Definition |
|---|---|
| Target | daily range (high against low) and absolute daily return (close against prior close) of the S&P 500 |
| Forecast | closing value of the volatility index on the prior day, converted to one day |
| Ranking | correlation of the logarithms of target and forecast |
| Explained variation | R² of a regression of the daily range on the forecast |
| Level | actual move divided by the implied one; share of days on which the close lies within one expected move around the prior close |
| Loss measure | QLIKE on the daily variance from high, low and overnight gap, smaller is better; difference to the VIX by Diebold and Mariano, clustered by month |
For the loss measure each forecast is scaled to the mean of 2015–2022. So it rates how well a forecast tells large and small days apart, and not its level.
2. Result
| Period | Forecast | correlation | R² daily range | actual / implied | close within | QLIKE | t against VIX |
|---|---|---|---|---|---|---|---|
| 2015–2022 (n 2,014) | VIX | 0.74 | 0.57 | 0.81 | 80.8 % | 0.44 | |
| VIX9D | 0.78 | 0.63 | 0.84 | 78.7 % | 0.37 | −6.7 | |
| realised, 20 days | 0.65 | 0.38 | 0.98 | 69.6 % | 0.62 | +3.8 | |
| 2023–2026 (n 934) | VIX | 0.58 | 0.42 | 0.75 | 81.9 % | 0.39 | |
| VIX9D | 0.62 | 0.49 | 0.79 | 79.3 % | 0.35 | −3.2 | |
| VIX1D | 0.65 | 0.53 | 0.89 | 73.8 % | 0.32 | −2.6 | |
| realised, 20 days | 0.39 | 0.14 | 0.96 | 68.2 % | 0.60 | +3.5 |
A negative t means: better than the VIX.
The order is the same in both periods and in every measure. The shorter the maturity, the better the implied volatility predicts the size of the next day. The VIX9D beats the VIX clearly in both periods, and from 2023 to 2026 the VIX1D is ahead once more. The realised volatility of the last 20 days is by far the worst forecast; since 2023 it explains only 14 % of the variation.
3. All three overstate
The second finding concerns the level. If the expected move were an unbiased estimate, the actual move would on average have to be as large as the implied one, and the close would lie within one expected move on about 68 % of days. In fact the market moves less:
- Calculated from the VIX, on average 0.75 times the implied move arrives, and the close lies within on 82 % of days.
- From the VIX9D 0.79 times, 79 % of days within.
- From the VIX1D 0.89 times, 74 % of days within.
The VIX overstates most, the VIX1D least. Realised volatility hits the level almost exactly (0.96) but tells large and small days apart worst.
4. Why the short maturity wins
The VIX averages over 30 days. If a rate decision or an inflation report is due tomorrow, that one day is in the VIX only to a small part, but in the VIX1D entirely. Conversely the VIX contains events of the coming weeks that have nothing to do with tomorrow. On top of that comes the premium that buyers of options pay for protection, which makes up a larger part of the price at longer maturities. That is a plausible explanation; what we measured here is only the forecast quality.
What this means
Anyone who needs an expected move for the current day, for instance for stop distance, position size or judging whether a move is already large, is better off with a short maturity: VIX1D before VIX9D before VIX. And anyone calculating from the VIX should know that on average only three quarters of it arrive. As in our study on VIX term structure and gamma: this is a statement about the size of the day. No direction follows from it.
Limits
- Descriptive. No trading rule, no gate fixed in advance, no holdout.
- Only the S&P 500. For Nasdaq 100, Dow or DAX with their own volatility indices the ranking is not measured.
- Short window for the VIX1D. 934 days. Its lead over the VIX9D is smaller than that of the VIX9D over the VIX, and each forecast is tested only against the VIX, not the VIX1D directly against the VIX9D.
- Prior day's closing value. The VIX1D at 16:00 contains premia for scheduled events and weekends. A value shortly before the open or the price of a straddle expiring the same day is not tested.
- Daily data of a freely available provider for the index.
All pattern families and holdouts in the overview. Related: the range forecast for the next two hours.
📄 Full study as PDF: 6 pages incl. all tables, figures and limits (in German).
Disclaimer: Historical statistics are no guarantee of future market behaviour. This study is not investment advice. Trading carries a risk of loss up to total loss.