Data basis: Release dates of the weekly EIA report (Weekly Petroleum Status Report) from the EIA archive, 794 dates 2011–2026. Prices: Dukascopy CFD minute data for WTI crude and natural gas, New York time. Search period 2015–2022 with 417 dates, 331 of them with a confirmed release time. The holdout from 2023 stayed untouched because the gate was missed. Costs for WTI 0.0625 USD per round trip, the entry right after the report calculated with a spread one and a half times as wide. Benchmarks: the same rule on Tuesdays at 10:30 without a report (placebo), random direction, five random markets. Pre-registered on 21 October 2026 before the price data was loaded (SHA-256 7079203b…). No trading recommendation.
Every Wednesday at 10:30 New York time (Thursday at 11:00 in holiday weeks) the US Energy Information Administration reports how crude and gasoline inventories changed. The oil price reacts within seconds. The question behind this: after the first five minutes does the price keep running in the same direction because the market processes the figures with a delay? Or was the reaction exaggerated and does it turn back?
Our earlier tests of macro and central bank dates showed no edge. Energy inventory data were not part of them.
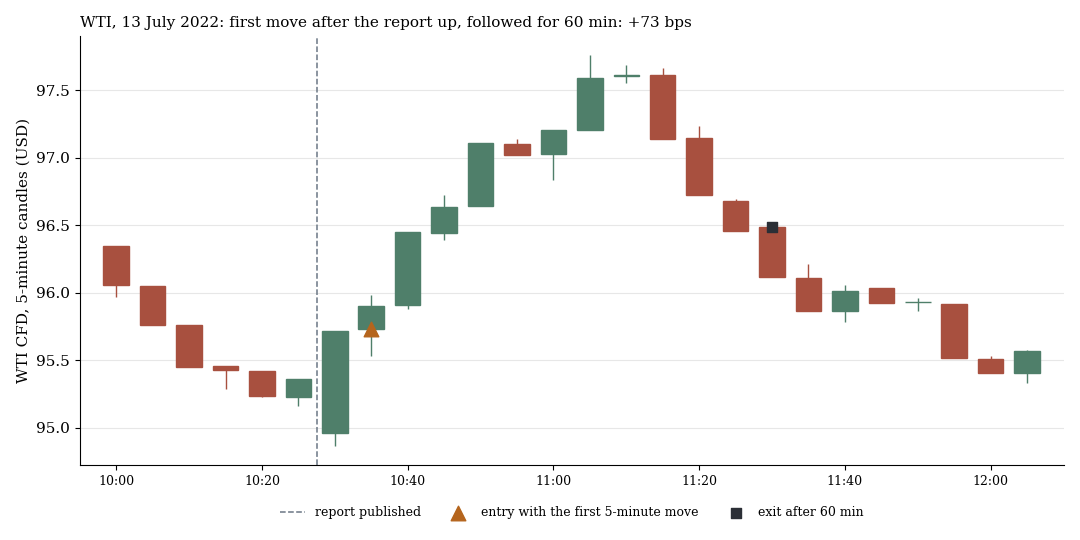
WTI, 13 July 2022: the price jumps up after the report and keeps going. Whoever follows the direction of the first five minutes is +73.0 bps after costs after 60 minutes.
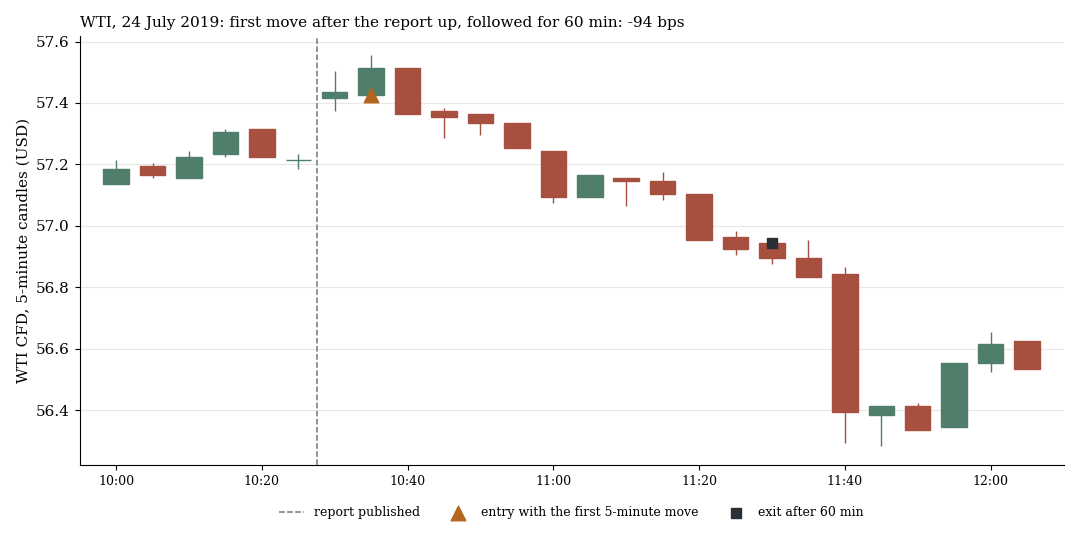
WTI, 24 July 2019: same rule, −94.5 bps. Both reports were drawn at random with a fixed seed (7) from the winning and the losing reports of the search period.
1. The rule
The reaction Q is the price change from the open of the minute before the report to the open five minutes after. Entry happens five minutes after the report, going along with the move or against the move (reversal), with exit after 30 or 60 minutes or at 14:30, the futures settlement. In addition a filter for the largest reactions, the top third of the last 52 reports. We check the release time only through the size of the move, never through its direction: a date counts if the largest one-minute move of the day falls at 10:30 or 11:00.
That makes twelve tests with multiple-testing correction. The primary rule is going along in the top third with a 60-minute hold. Gate: net t ≥ 2, q ≤ 0.10 and better than the placebo and random direction.
2. Result
| Exit | Filter | n | Going along net bps (t) | Reversal net bps (t) | Placebo Tuesday 10:30 (going along / reversal) |
|---|---|---|---|---|---|
| 30 minutes | all | 331 | −14.65 (−2.72) | −8.87 (−1.63) | −9.98 / −13.62 |
| 30 minutes | top third | 99 | −27.56 (−2.59) | +4.88 (0.47) | −5.83 / −16.54 |
| 60 minutes | all | 331 | −14.39 (−2.56) | −9.14 (−1.63) | −12.04 / −11.56 |
| 60 minutes | top third | 99 | −19.27 (−1.57) | −3.41 (−0.28) | −8.45 / −13.92 |
| 14:30 | all | 325 | −14.52 (−1.51) | −8.99 (−0.94) | −23.19 / −0.42 |
| 14:30 | top third | 96 | −15.30 (−0.75) | −7.46 (−0.37) | −13.90 / −8.47 |
WTI, net bps per trade after costs, search period 2015–2022. The primary rule is in bold.
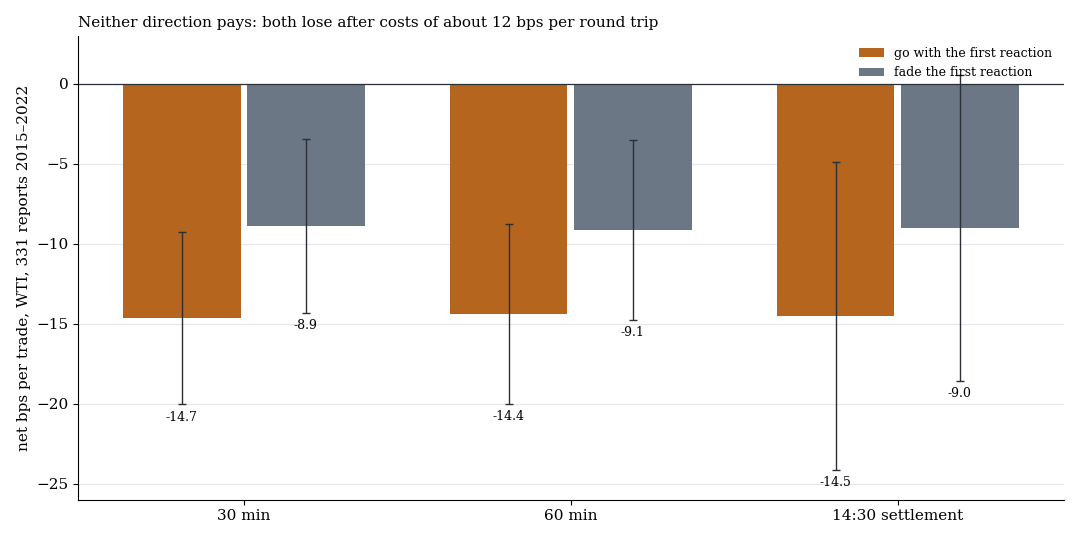
Net per trade, all 331 reports, orange going along, blue reversal, one standard error.
Both directions lose in every cell but one: the reversal in the top third at 30 minutes is at +4.88 bps (t 0.47, 99 cases). The primary rule earned −19.27 bps (t −1.57, q 1.00). On five random markets the same rule came out at −33.99, −9.94, +4.42, −56.13 and −25.68 bps, clearly negative on average. The 95th percentile of random directions was +6.72 bps. The Tuesday placebo loses about as much as the report day.
3. Why: the direction is almost zero, the costs are large
The direction can be read off the two columns. Going along and reversal carry the same costs and opposite directions. It follows that before costs the move after the first five minutes is worth −2.9 (30 minutes), −2.6 (60 minutes) and −2.8 bps (14:30), and the costs are about 11.8 bps per round trip.
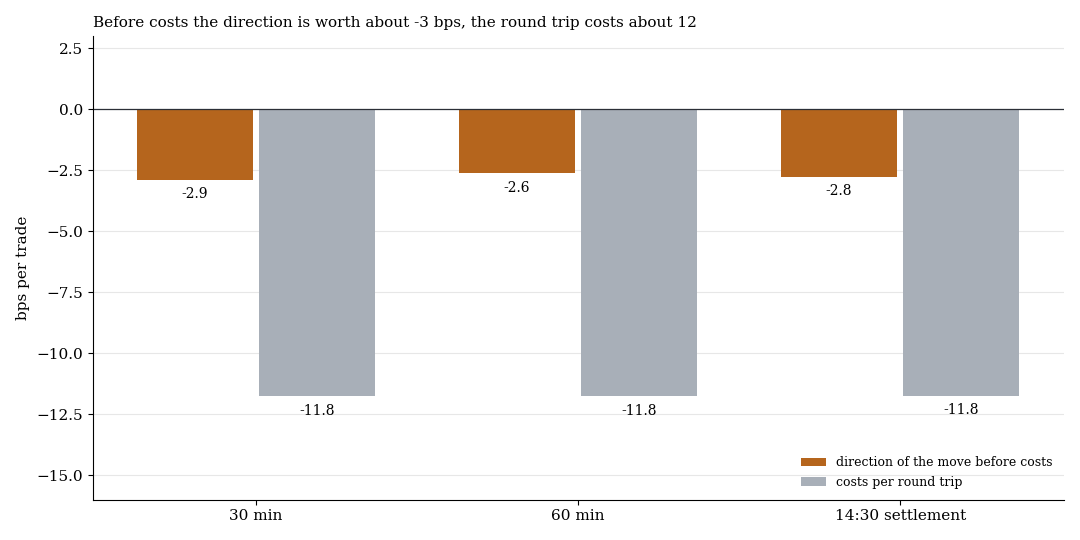
Derived from going along and reversal: direction before costs is (going along minus reversal) / 2, the costs are −(going along plus reversal) / 2.
The reaction is on average priced in after five minutes, there is nothing left to take that the costs would not swallow. Natural gas, the second storage report, is even more expensive: going along −31.21 bps (t −6.48), reversal −37.91 bps (t −7.86) at 30 minutes, about 35 bps of costs per round trip. The gas figures are purely descriptive, the dates there come from a rule (Thursday at 10:30) with a release-time check.
What it means
With freely available inventory data and a minute backtest no edge can be taken from the EIA report, neither by going along nor by leaning against it. The information is in the price after five minutes. Before costs the direction is slightly negative, and even an edge of a few bps would leave nothing at costs of about 12 bps.
Limits
- Dukascopy CFD instead of a broker. Spreads around the report can be considerably wider than assumed. That would rather raise the costs.
- No roll test. WTI CFDs roll monthly, roll jumps lie outside the measurement windows.
- Only the first reaction. We used only the price reaction, not the surprise of the inventory figure against expectations. The top third by move is only a stand-in for that.
- Not tested: entry and exit within the first five minutes (latency, fill quality), Brent, gasoline and distillate inventories separately.
- Holdout not run because the gate was missed. 2023–2026 stayed untouched.
All pattern families and holdouts in the overview. Related: news trading on gold and Bitcoin, macro dates intraday and US Treasury auctions.
📄 Full study as PDF: 6 pages incl. all tables, figures and limits (in German).
Disclaimer: Historical statistics are no guarantee of future market behaviour. This study is not investment advice. Trading carries a risk of loss up to total loss.