Data basis: US Treasury auction results (Fiscal Data, freely available) for notes and bonds with 2 to 30 years to maturity including reopenings, excluding inflation-protected and floating-rate securities, only auctions closing at 13:00 New York, 2014–2026. Prices: CFDs on the S&P 500, Nasdaq 100 and Dow, Dukascopy minute data. Search period 2015–2022 with 914 auction days, 374 of them with a long maturity. The holdout from 2023 stayed untouched because the gate was missed. Costs per round trip 0.8 / 2.5 / 4.0 index points, on average 1.6 to 3.4 bps (1 bp = 0.01%). Benchmarks: randomly swapped direction (2,000 times), always long on the same days, random markets, the same time window on days without an auction. Pre-registered on 21 October 2026 before the auction data was loaded (SHA-256 3c4899b0…). No trading recommendation.
The US Treasury auctions new government bonds almost every week. At 13:00 New York time the results are final. When demand is weak, the primary dealers have to take up the rest and hedge it, and yields rise. The popular reading: a weak auction then pushes stocks down too, a strong one supports them. If the market processes this slowly, the rest of the move could be traded.
Our earlier tests of macro dates such as rate decisions, payrolls and inflation data had shown no edge. Bond auctions were not part of them.
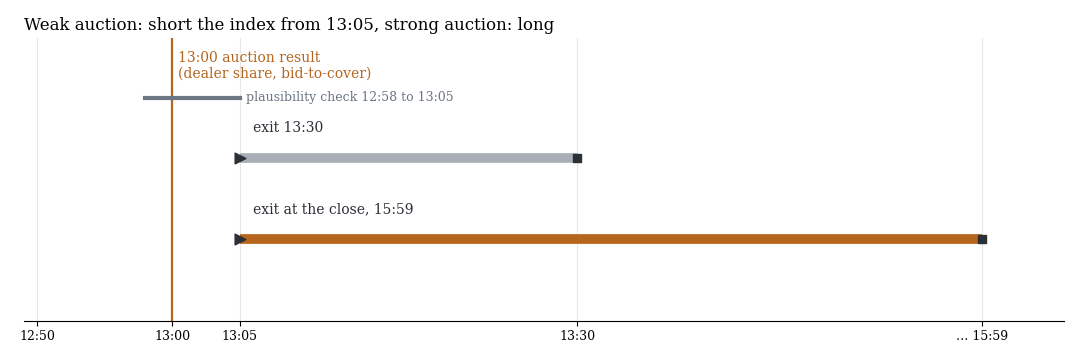
The rule: entry at 13:05 against a weak and with a strong auction, exit at 13:30 or at the cash close. Plus a plausibility check from 12:58 to 13:05.
1. Rule
For each auction we measure two values: the share the primary dealers had to take up, and the ratio of bids to the amount allotted (bid-to-cover). Both are standardised against the six previous auctions of the same maturity. Weakness W is dealer share minus coverage, both as z-scores. After a weak auction (W above 0) we go short, after a strong one long. Variants: all auctions or only those with an absolute W of 1 or more, exit at 13:30 or 15:59, all maturities or only 10, 20 and 30 years, three markets. The primary rule: long maturities, W of 1 or more, exit 15:59, averaged across the three markets per day. Gate: net t ≥ 2 and q ≤ 0.10 across 25 tests.
2. Result
| Maturities, threshold | Exit | S&P 500 | Nasdaq 100 | Dow |
|---|---|---|---|---|
| long, W from 1 | 15:59 | −3.73 (t −0.9) | −2.65 (t −0.5) | −2.43 (t −0.6) |
| long, W from 1 | 13:30 | −3.09 (t −2.3) | −2.44 (t −1.3) | −2.43 (t −2.0) |
| all, all auctions | 15:59 | −2.10 (t −0.7) | −2.75 (t −0.8) | −0.57 (t −0.2) |
| all, all auctions | 13:30 | −3.34 (t −4.0) | −4.04 (t −4.0) | −1.95 (t −2.5) |
Net bps per trade, search period 2015–2022.
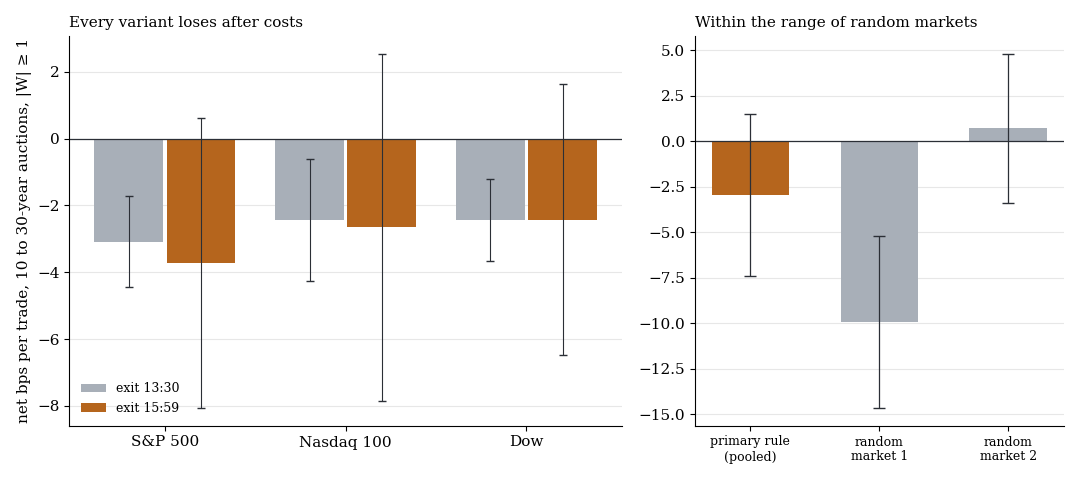
Left: long maturities with W from 1 per market, net with one standard error. Right: the primary rule against the same rule on two random markets.
The primary rule lost −2.94 bps per trade (139 days, t −0.66). Against randomly swapped directions (mean −3.17 bps) it is no better (p 0.47). On two random markets the same rule was at −9.95 and +0.70 bps. The best of the 24 variants reached +0.59 bps. The short exits at 13:30 are significantly negative because essentially only the costs apply there.
The plausibility check explains part of this: from 12:58 to 13:05 the indices moved in the expected direction by only +0.50 bps (t 1.4). Dealer share and coverage apparently capture the surprise of an auction only weakly. Auction days were somewhat more active than other days overall (mean move to the close 37.5 versus 32.9 bps), but without direction.
What it means
With freely available auction data no edge can be drawn from the bond auctions. Whether the indices process a real auction surprise with a delay remains open, because the professionals' key measure is missing from these data.
Limits
- No real tail. Professionals measure an auction by the difference between the allotment yield and the yield right before the auction (when-issued). Those data are not freely available; dealer share and bid-to-cover are only stand-ins.
- Few signals. The primary rule has 139 trading days, so an effect below about 9 bps cannot be detected.
- CFD instead of bond. Stock index CFDs were traded, not bonds or interest rate futures.
- Not tested: bond and rate futures themselves, short maturities (bills), auctions in Europe.
All pattern families and holdouts in the overview. Related: macro dates intraday, the SPY closing auction and our workflow since October 2026.
📄 Full study as PDF: 6 pages incl. all tables, figures and limits (in German).
Disclaimer: Historical statistics are no guarantee of future market behaviour. This study is not investment advice. Trading carries a risk of loss up to total loss.