Data basis: 71 consumer and retail stocks from the S&P 500 with 1,679 quarterly reports from October 2016 to 2022 (25 quarters). Proxies: views of the Wikipedia company articles including redirects, and Google Trends search interest, each as growth against the same quarter a year earlier, only from data before the report date. Targets: the sign of the EPS surprise against the Yahoo consensus, and the stock's price reaction against SPY from the close before to the close after the report. Revenue from SEC filings. In addition, five airlines with TSA passenger numbers. Measure: Spearman rank correlation (IC) per quarter, averaged (Fama-MacBeth). Benchmark: a random proxy (95th percentile), “always beat”. Pre-registered on 31 October 2026 (SHA-256 2d7dcf22…). No trading recommendation.
Funds buy satellite images of parking lots, card transactions and app data to know how a quarter went before the company reports it. That is expensive. Freely available are attention data: how often is a company's Wikipedia article viewed, how often is it searched for? The question was whether these free signals reveal something before the report that the market does not yet know.
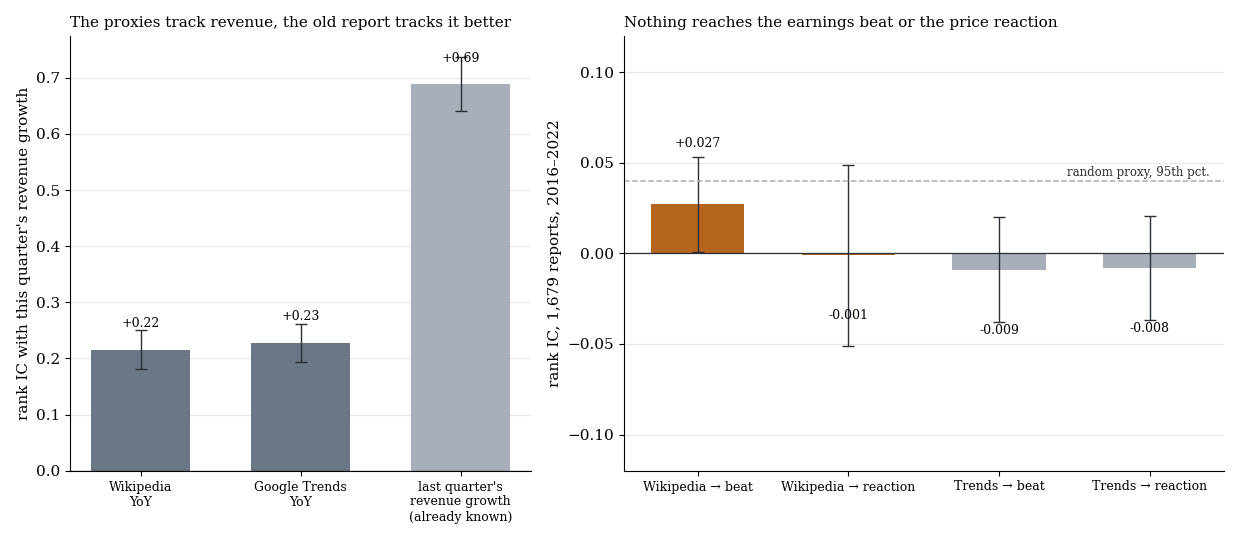
Left: rank correlation with the revenue growth of the reported quarter, for the two proxies and for the already known growth of the prior quarter. Right: rank correlation with the EPS beat and the price reaction, dashed the 95th percentile of a random proxy. With one standard error.
1. Result
| Test | n | IC | t | q |
|---|---|---|---|---|
| Wikipedia growth → beat (primary) | 1,669 | +0.027 | 1.03 | 0.71 |
| Wikipedia growth → price reaction (primary) | 1,669 | −0.001 | −0.02 | 0.71 |
| Wikipedia acceleration → beat / price reaction | 1,597 | +0.015 / −0.026 | 0.48 / −1.17 | |
| Google Trends growth → beat / price reaction | 1,603 | −0.009 / −0.008 | −0.31 / −0.28 | |
| Google Trends acceleration → beat / price reaction | 1,525 | −0.002 / +0.004 | −0.07 / +0.13 | |
| Airlines: TSA → beat (11 quarters) | 55 | ρ +0.52 | 1.82 | 0.07 |
| Airlines: TSA → price reaction | 55 | ρ −0.13 | −0.38 | 0.65 |
Search period October 2016 to 2022. No test reaches t 2 or beats the random proxy (95th percentile +0.038 to +0.044).
The base rate for an EPS beat is 72.1 %. The rule “proxy rises, so beat” is right 49.7 % (Wikipedia) and 48.8 % (Google Trends) of the time. In the top third of the proxies the beat rate is 72.7 % and 69.4 %, in the bottom third 70.3 % and 71.6 %, so the same. The price reaction is even worse in the top third than in the bottom one (Wikipedia −4.9 against +12.7 bps). As a trading rule with terciles from prior years, stock against SPY: −17 bps (Wikipedia, t −0.95) and −31 bps (Google Trends, t −1.66) per report after costs.
Airlines look better at first sight (ρ +0.52), but these are 11 quarters from pandemic years with one shared data series. That is not robust.
2. Why: the proxies only know what is already known
| descriptive | n | IC | t |
|---|---|---|---|
| Wikipedia → revenue growth of the quarter | 1,504 | +0.216 | 6.13 |
| Google Trends → revenue growth | 1,439 | +0.228 | 6.66 |
| Revenue growth of the prior quarter (known) → revenue growth | 1,293 | +0.689 | 14.11 |
| Wikipedia → revenue acceleration | 1,285 | +0.012 | 0.25 |
| Google Trends → revenue acceleration | 1,224 | +0.094 | 2.18 |
| Revenue acceleration (unknown beforehand) → price reaction | 1,293 | +0.140 | 4.45 |
The proxies follow revenue, but so does the last quarterly report, and much better. What the market does not know is the acceleration, and the proxies do not see it (Wikipedia IC +0.012). The target would be worth it: knowing the acceleration in advance gives an IC of +0.140 on the price reaction. Google Trends shows a weak remainder (IC +0.094, t 2.18), but it was one of many descriptive values, not registered in advance, and it reaches neither the beat nor the price.
What this means
Free attention data are no substitute for the data funds buy. They measure what is known. What funds really use, card transactions, location data and app panels, costs money and is not tested here. Related: Wikipedia attention after crashes and Drift after earnings in single stocks.
Limits
- EPS instead of revenue. A historical revenue consensus was not freely available. EPS beats are managed; even real revenue growth hardly explains them (IC +0.062).
- Survivorship. The universe is today's members.
- The Yahoo consensus is not identical to the professional databases.
- Holdout not run, because the gate (0 of 10 tests) was missed.
All pattern families and holdouts in the overview.
📄 Full study as PDF: 6 pages incl. all tables, figures and limits (in German).
Disclaimer: Historical statistics are no guarantee of future market behaviour. This study is not investment advice. Trading carries a risk of loss up to total loss.