Data basis: Dukascopy CFD minute data for the DAX, FTSE 100, Nasdaq 100 and Dow, January 2015 to June 2026, cash sessions only (DAX 09:00 to 17:30 Berlin, FTSE 08:00 to 16:30 London, Nasdaq 100 and Dow 09:30 to 16:00 New York). The “volume” is the tick volume of the CFD feed, not futures volume. All numbers are gross, in percent of the ATR (mean cash-session range of the previous 20 days). Benchmarks with identical code: random level at a POC-typical position, prior-day mid, prior close, VWAP. The tests were run on 25 September and 22 October 2026. The second fixed the window, benchmarks and measures in the script before the first run, the first predates our pre-registration with a checksum. Neither has a locked checksum, a parameter search or a holdout. No trading recommendation.
The point of control (POC) is the price level at which most was traded in the profile. It is regarded as the prior day's fair value, and from a trader's sentence we made a question: “short when the POC is lost, long when it is broken.” We measured three readings, crossing, bounce and magnet, and one claim from the TradingView community: a fixed-range profile that leaves out the New York morning delivers better respected levels.
The key is the comparison. A level somewhere in the prior day's range is crossed, touched and held now and then even without volume. So every POC figure is set against a random level: a level at the same relative position within the prior day's range, but taken from another, randomly drawn day, hence without any volume information. Only the difference counts.
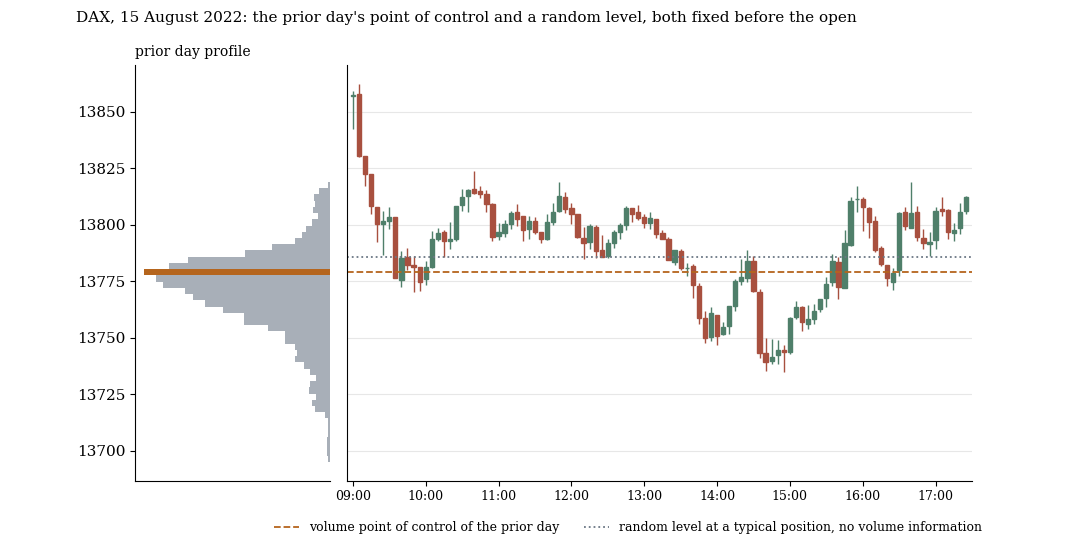
On the left the volume profile of the prior session, orange the POC. On the right the following day in 5-minute candles with the POC (orange, dashed) and a random level (grey, dotted). The day was drawn at random with a fixed seed (7).
1. Crossing: the rule from the question
The signal is the first 5-minute candle that closes on the other side of the level. The trade goes in the crossing direction: below short, above long. We measure the price move afterwards in percent of the ATR, after 15, 30, 60 and 120 minutes and to the close.
| Level | Europe: 60 min / to the close | US: 60 min / to the close |
|---|---|---|
| POC (volume) | −0.2 (t −0.4) / −0.2 (−0.1) | +0.7 (1.0) / +1.6 (1.3) |
| Random level | +0.1 (0.3) / +0.7 (0.8) | +1.0 (1.8) / +2.2 (2.1) |
| Prior-day mid | −0.7 (−1.4) / +1.0 (0.8) | +1.3 (1.9) / +0.8 (0.6) |
| Prior close | −0.2 (−0.4) / +0.4 (0.4) | −1.1 (−1.7) / +1.8 (1.5) |
Gross, % of the ATR, n per cell 2,656 to 3,156 (random level 7,741 to 7,983). Europe = DAX and FTSE, US = Nasdaq 100 and Dow.
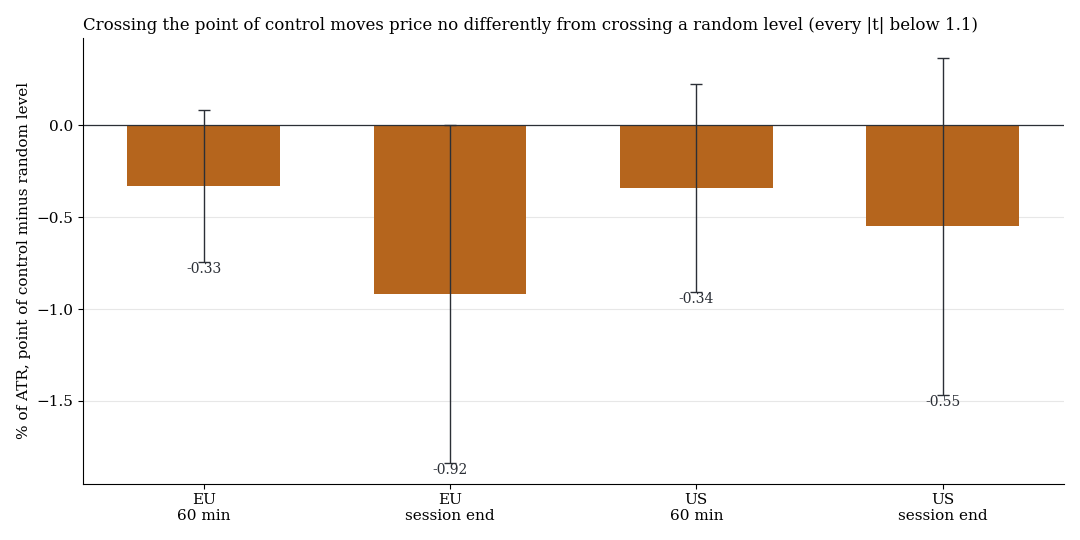
Difference POC minus random level per trade after 60 minutes and to the close, one standard error (clustered by trading day).
The POC is above the random level in no cell: Europe −0.33 (t −0.8) after 60 minutes and −0.92 (t −1.0) to the close, US −0.34 (t −0.6) and −0.55 (t −0.6). In the US you see a slight continuation after crossing any level (random level +2.0 after 120 minutes, t 2.7), which is general intraday momentum and has nothing to do with the POC. The volume source does not matter: the tick POC and the pure time POC (the price level where the price dwelled longest) sit on the same row at the median.
2. Bounce and magnet
Bounce. Enter at the first touch of the level, back in the direction of the approach. POC minus random level after 60 minutes: Europe +0.30 (t 0.6), US +0.13 (t 0.2); to the close +0.27 (t 0.3) and +0.35 (t 0.3). Nothing.
Magnet. Is the POC touched more often than its mirror image, a level of equal distance on the other side of the open?
| Level | Europe: touch minus mirror | US: touch minus mirror |
|---|---|---|
| POC | −0.4 percentage points (t −0.4) | +2.0 (1.7) |
| Random level | −0.4 (−0.4) | +1.5 (1.5) |
| Prior-day mid | −1.5 (−1.3) | +3.1 (2.6) |
| Prior close | −1.0 (−0.8) | +3.3 (2.6) |
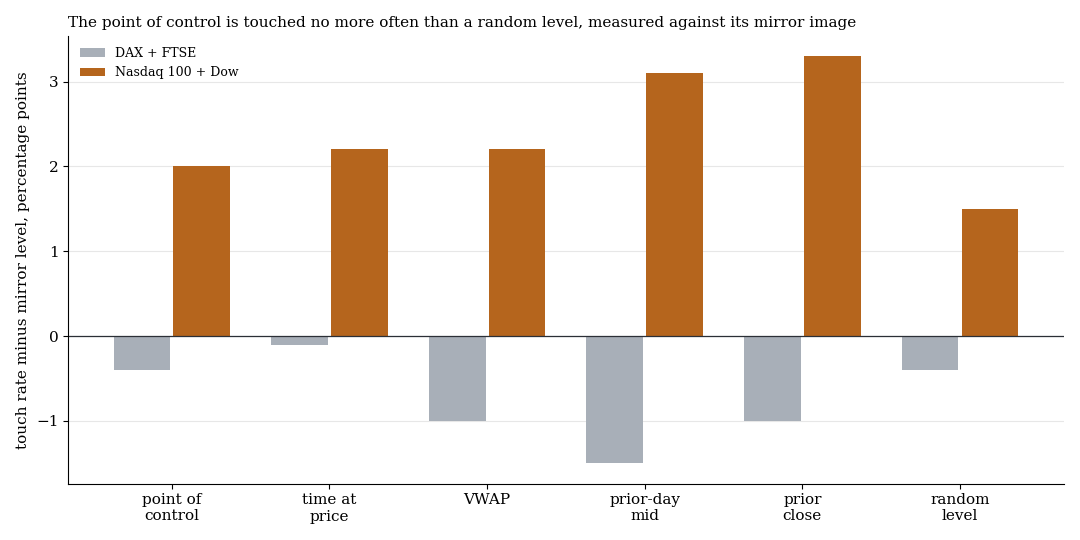
Difference of the touch rate to the mirror level in percentage points, Europe grey, US orange.
In Europe no level pulls. In the US the POC is at +2.0 percentage points (t 1.7), within the range of the random level (+1.5). Only prior-day mid and prior close reach t 2.6, and they are no POC effect either.
3. The running POC: a chop zone
If you carry the POC of the current day along, price crosses it 10.5 times a day on average in Europe and 8.8 times in the US. The running day mid is crossed only 6.2 and 4.7 times. A level crossed that often is not a line but a zone, where signals get burned by costs. We made an error of our own here: a pairing “both levels crossed on the same day” first produced fake t values of 5 to 7 because it filters out trend days. We discarded it and calculated per trade and per day, unpaired.
4. Fixed range without the New York morning
A TradingView user thought: a profile over a window between the sessions that excludes the New York morning session (14:30 to 17:00 Paris time) delivers better respected POC, VAH and VAL. We built the window from 17:00 on the prior day to 14:30 and checked the levels in the following New York morning session: first touch, bounce, DAX as the main market (about 2,600 touches), FTSE, Nasdaq 100 and Dow as replications. We compared with random levels and with the same profile over a window up to 14:30 of the prior day, that is, with the New York morning.
| DAX, 30 minutes after the touch | Difference | t |
|---|---|---|
| window without NY minus random level, move | +0.38% ATR | 1.1 |
| window without NY minus window with NY, move | +0.01% ATR | 0.0 |
| only the levels that differ between the two windows | −0.04% ATR | −0.1 |
| window without NY minus with NY, breakthrough within 30 minutes | −0.2 percentage points | −0.3 |
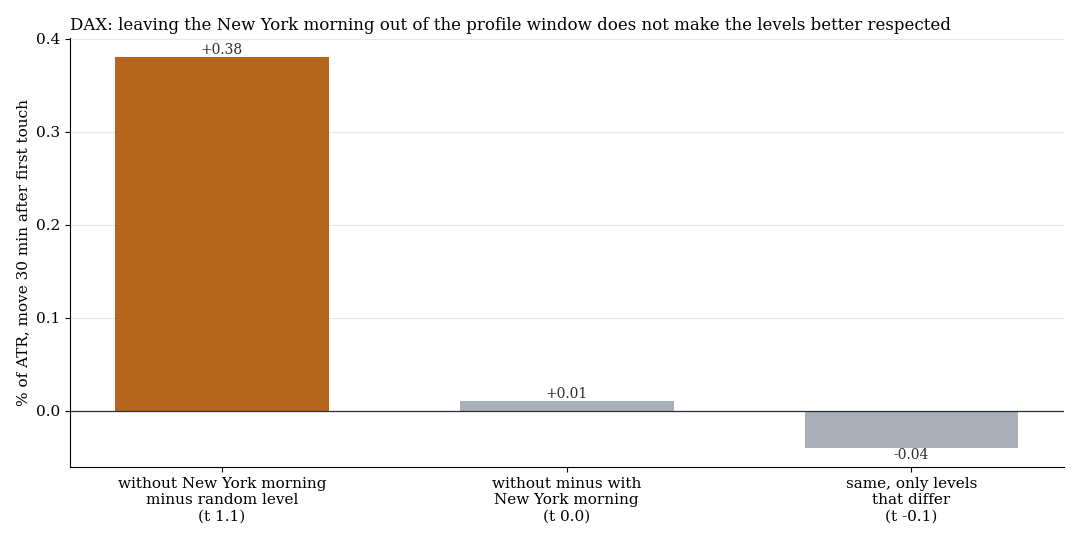
Move 30 minutes after the first touch in % of the ATR. Orange without the New York morning minus random level, grey minus the window with New York.
The reason the levels seem “respected”: every level touched in the New York morning session holds for 30 minutes without a breakthrough in about 60% of cases (DAX, FTSE) or about 50% (Nasdaq 100, Dow), a random level too. The POC with and without the New York morning is identical on about three quarters of the days (a distance of at least 0.05 ATR shows on only 16 to 30% of the days), VAH and VAL differ on about half. Leaving out the morning makes the results rather worse in Europe, and in the US it brings a small difference in breakthroughs (−1.3 percentage points, t −2.5) without any advantage in the move. The signs disagree by region, and with the number of comparisons a single t of 2.5 is noise.
What it means
The POC describes where trading took place, not where the price is going. Crossing, bounce and magnet effect cannot be told apart from a random level at the same position, in Europe and in the US. As a fair value marker on the chart the POC has value, as a signal in our data it has none. The result concerns the reaction to the level, not the question whether a profile is useful as a display.
Limits
- CFD tick volume. We had no real futures volume. The check whether the tick POC and the time POC sit on the same row suggests that it makes no difference for the verdict, it is not separately shown for the fixed-range window.
- Only the prior-day profile and the first touch. A profile over several days, composite profiles and order flow at the level are not tested.
- Gross. All numbers are before costs and in % of the ATR. A difference of zero before costs is no better after costs.
- Not locked. Both tests ran without a locked checksum and without a holdout. The verdict rests on differences against random levels, not on a gate.
- Not tested: naked POC over several days, the 80 percent rule of the value area, migration of the POC as a trend filter, composite profiles.
All pattern families and holdouts in the overview. Related: volume gates create phantom edges, Fibonacci zones against the random market and the random market as a ruler.
📄 Full study as PDF: 8 pages incl. all tables, figures and limits (in German).
Disclaimer: Historical statistics are no guarantee of future market behaviour. This study is not investment advice. Trading carries a risk of loss up to total loss.